Meaning-First Data Modeling, A Radical Return to Simplicity

Person uses language. Person speaks language.Meaning-First Data Modeling, A Radical Return to Simplicity Person learns language. We spend the early years of life learning vocabulary and grammar in order to generate and consume meaning. As a result of constantly engaging in semantic generation and consumption, most of us are semantic savants. This Meaning-First approach is our default until we are faced with capturing meaning in databases. We then revert to the Structure-First approach that has been beaten into our heads since Codd invented the relational model in 1970. This blog post presents Meaning-First data modeling for semantic knowledge graphs as a replacement to Structure-First modeling. The relational model was a great start for data management, but it is time to embrace a radical return to simplicity: Meaning-First data modeling.

This is a semantic exchange, me as a writer and you as a reader. The semantic mechanism by which it all works is comprised of a subject-predicate-object construct. The subject is a noun to which the statement’s meaning is applied. The predicate is the verb, the action part of the statement. The object is also generally a noun, the focus of the action. These three parts are the semantic building blocks of language and the focus of this post, semantic knowledge graphs.

In Meaning-First semantic data models the subject-predicate-object construct  is called a triple, the foundational structure upon which semantic technology is built. Simple facts are stated with these three elements, each of which is commonly surrounded by angle brackets. The first sentence in this post is an example triple. <Person> <uses> <language>. People will generally get the same meaning from it. Through life experience, people have assembled a working knowledge that allows us to both understand the subject-predicate-object pattern as well as what people and language are. Since computers don’t have life experience, we must fill in some details to allow this same understanding to be reached. Fortunately, a great deal of this work has been done by the World Wide Web Consortium (W3C) and we can simply leverage those standards.

Modeling the triple “Person uses language” in Figure 1, Triple diagram using arrows and ovals is a good start. Tightening the model by adding formal definitions makes it more robust and less ambiguous. These definitions come from gist, Semantic Arts’ minimalist upper level ontology. The subject, <Person>, is defined as “A Living Thing that is the

Meaning-First Data Modeling, A Radical Return to Simplicity
Figure 1, Triple diagram

offspring of some Person and that has a name.” The object, <Language>, is defined as “A recognized, organized set of symbols and grammar”. The predicate, <uses>, isn’t defined in gist, but could be defined as something like “Engages with purpose”. It is the action linking <Person> to <Language> to create the assertion about Person. Formal definitions for subjects and objects are useful because they are mathematically precise. They can be used by semantic technologies to reach the same conclusions as can a person with working knowledge of these terms.


Surprise! This single triple is (almost) an ontology. This is almost an ontology because it contains formal definitions and is in the form of a triple. Almost certainly, it is the world’s smallest ontology, and it is missing a few technical components, but it is a good start on an ontology all the same. The missing components come from standards published by the W3C which won’t be covered in detail here. To make certain the progression is clear, a quick checkpoint is in order. These are the assertions so far:

  • A triple is made up of a <Subject>, a <Predicate>, and an <Object>.
  • <Subjects> are always Things, e.g. something with independent existence including ideas.
  • <Predicates> create assertions that
    • Connect things when both the Subject and Object are things, or
    • Make assertions about things when the Object is a literal
  • <Objects> can be either
    • Things or
    • Literals, e.g. a number or a string

These assertions summarize the Resource Description Framework (RDF) model. RDF is a language for representing information about resources in the World Wide Web. Resource refers to anything that can be returned in a browser. More generally, RDF enables Linked Data (LD) that can operate on the public internet or privately within an organization. It is the simple elegance embodied in RDF that enables Meaning-First Data Modeling’s radically powerful capabilities. It is also virtually identical to the linguistic building blocks that enabled cultural evolution: subject, predicate, object.

Where RDF defines the framework that defines the triple, Resource Description Framework Schema (RDFS) provides a data-modeling vocabulary for building RDF triples. RDFS is an extension of the basic RDF vocabulary and is leveraged by higher-level languages such as Web Ontology Language (OWL), and Dublin Core Metadata Initiative (Dcterms). RDFS supports constructs for declaring that resources, such as Living Thing and Person, are classes. It also enables establishing subclass relationships between classes so the computer can make sense of the formal Person definition “A Living Thing that is the offspring of some Person and that has a name.”

Here is a portion of the schema supporting the opening statement in this post,

Figure 2, RDFS subclass property

“Person uses Language”. For simplicity, the ‘has name’ portion of the definition has been omitted from this diagram, but it will show up later.Figure 2 shows the RDFS subClassOf property as a named arrow connecting two ovals. This model is correct as it shows the subClassOf property, yet it isn’t quite satisfying. Perhaps it is even a bit ambiguous because through the lens of traditional, Structure-First data modeling, it appears to show two tables with a connecting relationship.


Nothing could be further from the truth.

There are two meanings here and they are not connected structures. The Venn diagram in Figure 3, RDFS subClassOf Venn diagram more clearly shows the Person set is wholly contained within the set of all Living

Figure 3, RDFS subClassOf Venn diagram

Things so it is also a Living Thing. There is no structure separating them. They are in fact both in one single structure; a triple store. They are differentiated only by the meaning found in their formal definitions which create membership criteria of two different sets. The first set is all Living Things. The second set, wholly embedded within the set of all Living Things, is the set of all Living Things that are also the offspring of some Person and that have a name. Person is a more specific set with criteria that causes a Living Thing to be a member of the Person set but is also still a member of the Living Things set.

Rather than Structure-First modeling, this is Meaning-First modeling built upon the triple defined by RDF with the schema articulated in RDFS. There is virtually no structure beyond the triple. All the triples, content and schema, commingle in one space called a triple store.

Figure 4, Complete schema

Here is some informal data along with the simple ontology’s model:

Schema:

  • <Person> <uses> <Language>

Content:

  • <Mark> <uses> <English>
  • <Boris > <uses> <Russian>
  • <Rebecca> <uses> <Java>
  • <Andrea> <uses> <OWL>

Contained within this sample data lies a demonstration of the radical simplicity of Meaning-First data modeling. There are two subclasses in the data content not   currently

Figure 5, Updated Language Venn diagram

modeled in the schema, yet they don’t violate the schema. The Figure 5 shows subclasses added to the schema after they have been discovered in the data. This can be done in a live, production setting without breaking anything! In a Structure-First system, new tables and joins would need to be added to accommodate this type of change at great expense and over a long period of time. This example just scratches the radical simplicity surface of Meaning-First data modeling.


Stay tuned for the next installment and a deeper dive into Meaning-First vs Structure-First data modeling!

Facet Math: Trim Ontology Fat with Occam’s Razor

Facet Math: Trim Ontology Fat with Occam's RazorAt Semantic Arts we often come across ontologies whose developers seem to take pride in the number of classes they have created, giving the impression that more classes equate to a better ontology. We disagree with this perspective and as evidence, point to Occam’s Razor, a problem-solving principle that states, “Entities should not be multiplied without necessity.” More is not always better. This post introduces Facet Math and demonstrates how to contain runaway class creation during ontology design.

Semantic technology is suited to making complex information intellectually manageable and huge class counts are counterproductive. Enterprise data management is complex enough without making the problem worse. Adding unnecessary classes can render enterprise data management intellectually unmanageable. Fortunately, the solution comes in the form of a simple modeling change.

Facet Math leverages core concepts and pushes fine-grained distinction to the edges of the data model. This reduces class counts and complexity without losing any informational fidelity. Here is a scenario that demonstrates spurious class creation in the literature domain. Since literature can be sliced many ways, it is easy to justify building in complexity as data structures are designed. This example demonstrates a typical approach and then pivots to a more elegant Facet Math solution.Facet Math: Trim Ontology Fat with Occam's Razor

A taxonomy is a natural choice for the literature domain. To get to each leaf, the whole path must be modeled adding a multiplier with each additional level in the taxonomy. This case shows the multiplicative effect and would result in a tree with 1000 leaves (10*10*10) assuming it had:
10 languages
10 genres
10 time periods

Taxonomies typically are not that regular though they do chart a path from the topmost concept down to each leaf. Modelers tend to model the whole path which multiplies the result set. Having to navigate taxonomy paths makes working with the information more difficult. The path must be disassembled to work with the components it has aggregated.

This temptation to model taxonomy paths into classes and/or class hierarchies creates a great deal of complexity. The languages, genres, and time periods in the example are really literature categories. This is where Facet Math kicks in taking an additive approach by designing them as distinct categories. Using those categories for faceted search and dataset assembly returns all the required data. Here is how it works.

Facet Math: Trim Ontology Fat with Occam's Razor

To apply Facet Math, remove the category duplication from the original taxonomy by refactoring them as category facets. The facets enable exactly the same data representation:
10 languages
10 genres
10 time periods

By applying Facet Math principles, the concept count is reduced by two orders of magnitude. Where the paths multiplied to produce 1000 concepts, facets are only added and there are now only 30. This results in two orders of magnitude reduction!

Sure, this is a simple example. Looking at a published ontology might be more enlightening.

SNOMED (Systematized Nomenclature of Medicine—Clinical Terms) ontology is a real-world example.

Since the thesis here is looking at fat reduction, here is the class hierarchy in SNOMED to get from the top most class to Gastric Bypass.Facet Math: Trim Ontology Fat with Occam's Razor

Notice that Procedure appears in four levels, Anastomosis and Stomach each appear in two levels. This hierarchy is a path containing paths.

SNOMED’s maximum class hierarchy depth is twenty-seven. Given the multiplicative effect shown above in the first example, SNOMED having 357,533 classes, while disappointing, is not surprising. The medical domain is highly complex but applying Facet Math to SNOMED would surely generate some serious weight reduction. We know this is possible because we have done it with clients. In one case Semantic Arts produced a reduction from over one hundred fifty thousand concepts to several hundred without any loss in data fidelity.

Bloated ontologies contain far more complexity than is necessary. Humans cannot possibly memorize a hundred thousand concepts, but several hundred are intellectually manageable. Computers also benefit from reduced class counts. Machine Learning and Artificial Intelligence applications have fewer, more focused concepts to work with so they can move through large datasets more quickly and effectively.

It is time to apply Occam’s Razor and avoid creating unnecessary classes. It is time to design ontologies using Facet Math.

Property Graphs: Training Wheels on the way to Knowledge Graphs

I’m at a graph conference. The general sense is that property graphs are much easier to get started with than Knowledge Graphs. I wanted to explore why that is, and whether it is a good thing.

It’s a bit of a puzzle to us, we’ve been using RDF and the Semantic Web stack for almost two decades, and it seems intuitive, but talking to people new to graph databases there is a strong preference to property graphs (at this point primarily Neo4J and TigerGraph, but there are others). – Dave McComb

Property Graphs

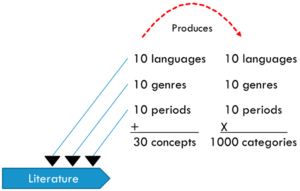
A knowledge graph is a database that stores information as digraphs (directed graphs, which are just a link between two nodes).

Property Graphs: Training Wheels on the way to Knowledge Graphs

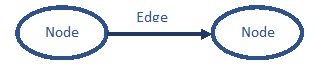
The nodes self-assemble (if they have the same value) into a completer and more interesting graph.

Property Graphs: Training Wheels on the way to Knowledge Graphs

What makes a graph a “property graph” (also called a “labeled property graph”) is the ability to have values on the edges

Either type of graph can have values on the nodes, in a Knowledge Graph they are done with a special kind of edge called a “datatype Property.”

Property Graphs: Training Wheels on the way to Knowledge Graphs

Property Graphs: Training Wheels on the way to Knowledge Graphs

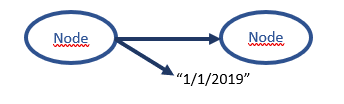
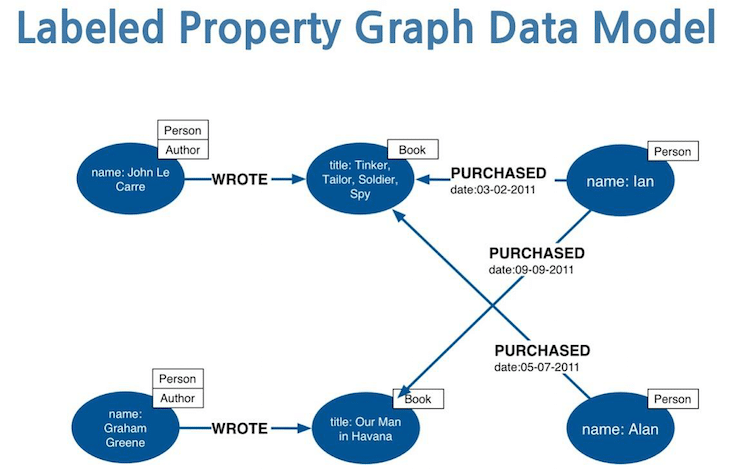
Here is an example of one of the typical uses for values on the edges (the date the edge was established).  As it turns out this canonical example isn’t a very good example, in most databases, graph or otherwise, a purchase would be a node with many other complex relationships.

The better use of dates on the edges in property graphs are where there is what we call a “durable temporal relation.” There are some relationships that exist for a long time, but not forever, and depending on the domain are often modeled as edges with effective start and end dates (ownership, residence, membership are examples of durable temporal relations that map well to dates on the edges)

The other big use case for values on the edges which we’ll cover below.

The Appeal of Property Graphs

Talking to people and reading white papers, it seems the appeal of Property Graph data bases are in these areas:

  • Closer to what programmers are used to
  • Easy to get started
  • Cool Graphics out of the box
  • Attributes on the edges
  • Network Analytics

Property Graphs are Closer to What Programmers are Used to

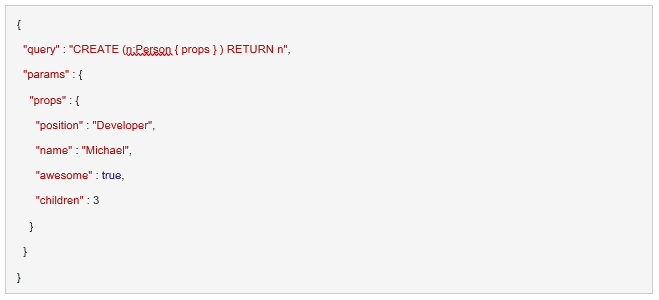
The primary interfaces to Property Graphs are json style APis, which developers are comfortable with and find easy to adapt to.

Property Graphs: Training Wheels on the way to Knowledge Graphs

Easy to Get Started

Neo4J in particular have done a very good job of getting people set up and running and productive in short order.  There are free versions to get started with, and well exercised data sets to get up and going rapidly. This is very satisfying for people getting started.

Property Graphs: Training Wheels on the way to Knowledge Graphs

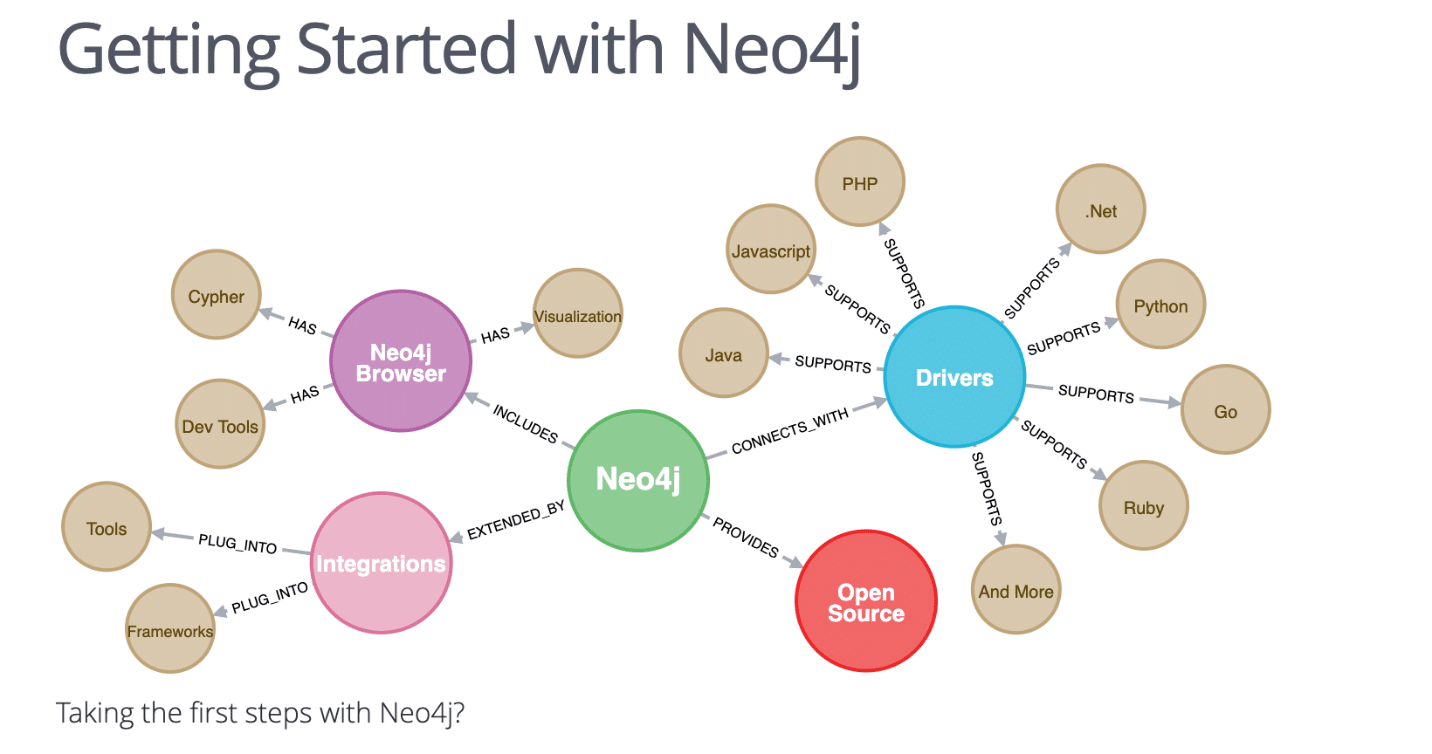
Cool Graphics Out of the Box

One of the striking things about Neo4J is their beautiful graphics

Property Graphs: Training Wheels on the way to Knowledge Graphs

You can rapidly get graphics that often have never been seen in traditional systems, and this draws in the attention of sponsors.

Property Graphs have Attributes on the Edges

Perhaps the main distinction between Property Graphs and RDF Graphs is the ability to add attributes to the edges in the network.  In this case the attribute is a rating (this isn’t a great example, but it was the best one I could find easily).

Property Graphs: Training Wheels on the way to Knowledge Graphs

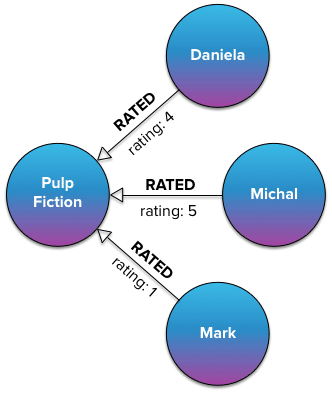
One of the primary use cases for attributes on the edges would be weights that are used in the evaluation of network analytics.  For instance, a network representation of how to get from one town to another, might include a number of alternate sub routes through different towns or intersections.  Each edge would represent a segment of a possible journey.  By putting weights on each edge that represented distance, a network algorithm could calculate the shortest path between two towns.  By putting weights on the edges that represent average travel time, a network algorithm could calculate the route that would take the least time.

Other use cases for attributes on the edges include temporal information (when did this edge become true, and when was is no longer true), certainty (you can rate the degree of confidence you have in a given link and in some cases only consider links that are > some certainly value), and popularity (you could implement the page rank algorithm with weights on the edges, but I think it might be more appropriate to put the weights on the nodes)
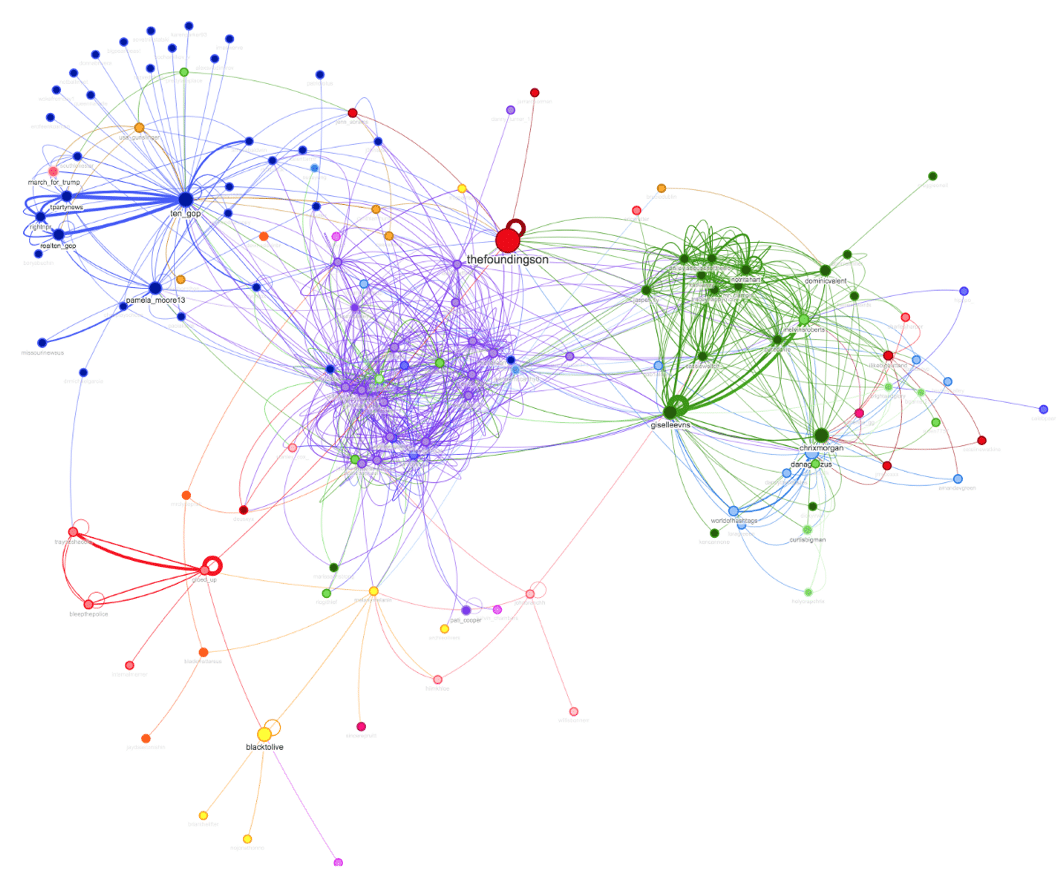
Network Analytics

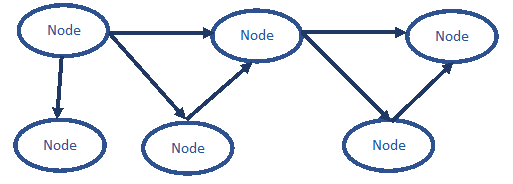
There are a wide range of network analytics that come out of the box and are enabled in the property graph.  Many do not require attributes on the edges, for instance the “clustering” and “strength of weak ties” suggested in this graphic can be done without attributes on the edges.

Property Graphs: Training Wheels on the way to Knowledge Graphs

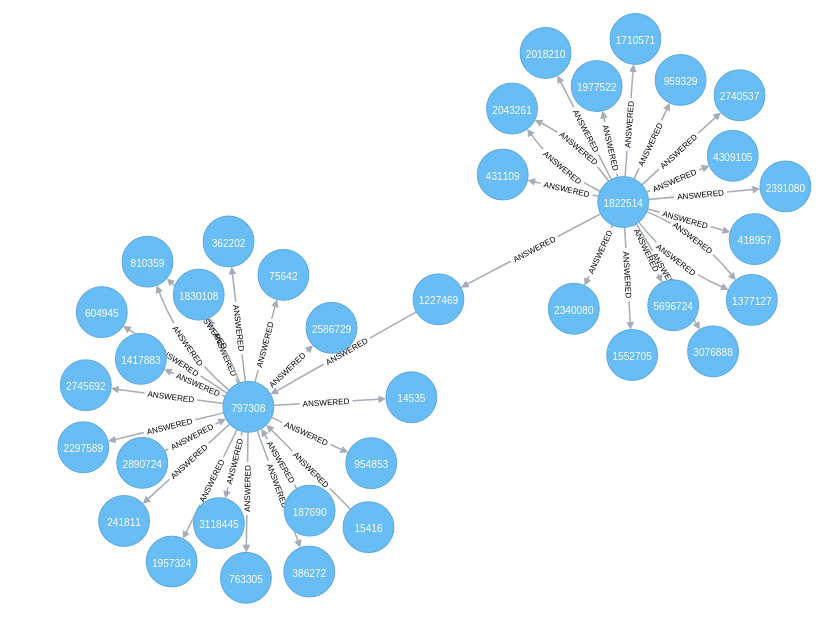
However, many of the network analytics algorithms can take advantage of and gain from weights on the edges.

Property Graphs: What’s Not to Like

That is a lot of pluses on the Property Graph side, and it explains their meteoric rise in popularity.

Our contention is that when you get beyond the initial analytic use case you will find yourself in a position of needing to reinvent a great body of work that already exists and have been long standardized.  At that point if you have over committed to Property Graphs you will find yourself in a quandary, whereas if you positioned Property Graphs as a stepping stone on the way to Knowledge Graphs you will save yourself a lot unnecessary work.

Property Graphs, What’s the Alternative?

The primary alternative is an RDF Knowledge Graph.  This is a graph database using the W3C’s standards stack including RDF (resource description framework) as well as many other standards that will be described below as they are introduced.

The singular difference is the RDF Knowledge Graph standards were designed for interoperability at web scale.  As such all identifiers are globally unique, and potentially discoverable and resolvable.  This is a gigantic advantage when using knowledge graphs as an integration platform as we will cover below.

Where You’ll Hit the Wall with Property Graphs

There are a number of capabilities, we assume you’ll eventually want to add on to your Property Graph stack, such as:

  • Schema
  • Globally Unique Identifiers
  • Resolvable identifiers
  • Federation
  • Constraint Management
  • Inference
  • Provenance

Our contention is you could in principle add all this to a property graph, and over time you will indeed be tempted to do so.  However, doing so is a tremendous amount of work, high risk, and even if you succeed you will have a proprietary home-grown version of all these things that already exist, are standardized and have been in large scale production systems.

As we introduce each of these capabilities that you will likely want to add to your Property Graph stack, we will describe the open standards approach that already covers it.

Schema

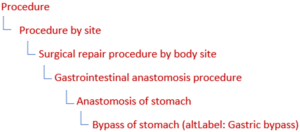
Property Graphs do not have a schema.  While big data lauded the idea of “schema-less” computing, the truth is, completely removing schema means that a number of functions previously performed by schema have now moved somewhere else, usually code. In the case of Property Graphs, the nearest equivalent to a schema is the “label” in “Labeled Property Graph.” But as the name suggests, this is just a label, essentially like putting a tag on something.  So you can label a node as “Person” but that tells you nothing more about the node.  It’s easier to see how limited this is when you label a node a “Vanilla Swap” or “Miniature Circuit Breaker.”

Knowledge Graphs have very rich and standardized schema.  One of the ways they allow you to have the best of both worlds, is unlike relational databases they do not require all schema to be present before any data can be persisted. At the same time when you are ready to add schema to your graph, you can do so with a high degree of rigor and go to as much or as little detail as necessary.

Globally Unique Identifiers

The identifiers in Property Graphs are strictly local.  They don’t mean anything outside the context of the immediate database.  This is a huge limitation when looking to integrate information across many systems and especially when looking to combine third party data.

Knowledge Graphs are based on URIs (really IRIs).  Uniform Resource Identifiers (and their Unicode equivalent, which is a super set, International Resource Identifiers) are a lot like URLs, but instead of identifying a web location or page, they identify a “thing.” In best practices (which is to say 99% of all the extant URIs and IRIs out there) the URI/IRI is based on a domain name.  This delegation of id assignment to organizations that own the domain names allows relatively simple identifiers that are not in danger of being mistakenly duplicated.

Every node in a knowledge graph is assigned a URI/IRI, including the schema or metadata.  This makes discovering what something means as simple as “following your nose” (see next section)

Resolvable Identifiers

Because URI/IRIs are so similar to URLs, and indeed in many situations are URLs it makes it easy to resolve any item.  Clicking on a URI/IRI can redirect to a server in the domain name of the URI/IRI, which can then render a page that represents the Resource.  In the case of a schema/ metadata URI/IRI the page might describe what the metadata means.  This typically includes both the “informal” definition (comments and other annotations) as well as the “formal” definition (described below).

For a data URI/IRI the resolution might display what is known about the item (typically the outgoing links), subject to security restrictions implemented by the owner of the domain.  This style of exploring a body of data, by clicking on links and exploring is called “following your nose” and is a very effective way of learning a complex body of knowledge, because unlike traditional systems you do not need to know the whole schema in order to get started.

Property Graphs have no standard way of doing this.  Anything that is implemented is custom for the application at hand.

Federation

Federation refers to the ability to query across multiple databased to get a single comprehensive result set.  This is almost impossible to do with relational databases.  No major relational database vendor will execute queries across multiple databases and combine the result (the result generally wouldn’t make any sense anyway as the schemas are never the same).  The closest thing in traditional systems, is the Virtual Data P***, which allows some limited aggregation of harmonized databases.

The Property Graphs also have no mechanism for federation over more than a single in memory graph.

Federation is built into SPARQL (the W3C standard for querying “triple stores” or RDF based Graph Databases).  You can point a SPARQL query at a number of databases (including relational databases that have been mapped to RDF through another W3C standard, R2RML).

Constraint Management

One of the things needed in a system that is hosting transactional updates, is the ability to enforce constraints on incoming transactions.  Suffice it to say Property Graphs have no transaction mechanism and no constraint management capability.

Knowledge Graphs have the W3C standard, SHACL (SHApes Constraint Language) to specify constraints in a model driven fashion.

Inference

Inference is the creation of new information from existing information.  A Property Graph creates a number of “insights” which are a form of inference, but it is really only in the heads of the persons running the analytics and interpreting what the insight is.

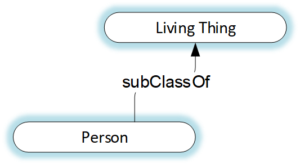
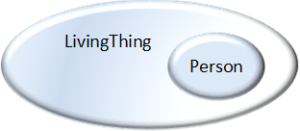
Knowledge Graphs have several inference capabilities.  What they all share is that the result of the inference is rendered as another triple (the inferred information is another fact which can be expressed as a triple).  In principle almost any fact that can be asserted in a Knowledge Graph can also be inferred, provided the right contextual information.  For instance, we can infer that a class is a subclass of another class.  We can infer that a node has a given property, we can infer that two nodes represent the same real-world items, and each of these inferences can be “materialized” (written) back to the database.  This makes any inferred fact available to any human reviewing the graph, and process that acts on the graph, including queries.

Two of the prime creators of inferred knowledge are RDFS and  OWL, the W3C standards for schema.  RDFS provides the simple sort of inference that people familiar with Object Oriented programming might be familiar with, primarily the ability infer that a node that is a member of a class is also a member of any of its superclasses.  A bit new to many people is the idea that properties can have superproperties, and that leads to inference at the instance level.  If you make the assertion that you have a mother  (property :hasMother) Beth, and then declare :hasParent to be a superproperty of :hasMother, the system will infer that you :hasParent Beth, and this process can be repeated by making :has Ancestor a superproperty of :hasParent. The system can infer and persist this information.

OWL (the Web Ontology Language for dyslexics) allows for much more complex schema definitions.  OWL allows you to create class definitions from Booleans, and allows the formal definition of classes by creating membership definitions based on what properties are attached to nodes.

If RDFS and OWL don’t provide sufficient rigor and/or flexibility there are two other options, both rule languages and both will render their inferences as triples that can be returned to the triple store.  RIF (the Rule Interchange Format) allow inference rules defined in terms of “if / then“ logic.  SPARQL the above-mentioned query language can also be used to create new triples that can be rendered back to the triple store.

Provenance

Provenance is the ability to know where any atom of data came from.  There are two provenance mechanisms in Knowledge Graphs.  For inferences generated from RDFS or OWL definitions, there is an “explain” mechanism, which is decribed in the standards as “proof.” In the same spirit as a mathematical proof, the system can reel out the assertions including schema-based definitions as data level assertions that led to the provable conclusion of the inference.

For data that did not come from inference (that was input by a user, or purchased, or created through some batch process, there is a W3C standard, call PROV-O (the provenance ontology) that outlines a standard way to describe where a data set or even an individual atom of data came from.

Property Graphs have nothing similar.

Convergence

The W3C held a conference to bring together the labeled property graph camp with the RDF knowledge graph camp in Berlin in March of 2019.

One of our consultants attended and has been tracking the aftermath.  One promising path is RDF* which is being mooted as a potential candidate to unify the two camps.  There are already several commercial implementations supporting RDF*, even though the standard hasn’t even begun its journey through the approval process. We will cover RDF* in a subsequent white paper.

Summary

Property Graphs are easy to get started with.  People think RDF based Knowledge Graphs are hard to understand, complex and hard to get started with. There is some truth to that characterization.

The reason we made the analogy to “training wheels” (or “stepping stones” in the middle of the article) is to acknowledge that riding a bike is difficult.  You may want to start with training wheels.  However, as you become proficient with the training wheels, you may consider discarding them rather than enhancing them.

Most of our clients start directly with Knowledge Graphs, but we recognize that that isn’t the only path.  Our contention is that a bit of strategic planning up front,  outlining where this is likely to lead gives you a lot more runway.  You may choose to do your first graph project using a property graph, but we suspect that sooner or later you will want to get beyond the first few projects and will want to adopt an RDF / Semantic Knowledge Graph based system.
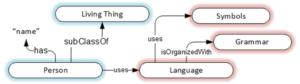
Toss Out Metadata That Does Not Bring Joy

As I write this, I can almost hear you wail “No, no, we don’t have too much metadata, we don’t have nearly enough!  We have several projects in flight to expand our use of metadata.”

Sorry, I’m going to have to disagree with you there.  You are on a fool’s errand that will just provide busy work and will have no real impact on your firm’s abilityThe Data-Centric Revolution: Implementing a Data-Centric Architecture to make use of the data they have.

Let me tell you what I have seen in the last half dozen or so very large firms I’ve been involved with, and you can tell me if this rings true for you.  If you are in a mid-sized or even small firm you may want to divide these numbers by an appropriate denominator, but I think the end result will remain the same.

Most large firms have thousands of application systems.  Each of these systems have data models that consist of hundreds of tables and many thousands of columns.  Complex applications, such as SAP, explode these numbers (a typical SAP install has populated 90,000 tables and a half million columns).

Even as we speak, every vice president with a credit card is unknowingly expanding their firm’s data footprint by implementing suites of SaaS (Software as a Service) applications.  And let’s not even get started on your Data Scientists.  They are rabidly vacuuming up every dataset they can get their hands on, in the pursuit of “insights.”

Naturally you are running out of space, and especially system admin bandwidth in your data centers, so you turn to the cloud.  “Storage is cheap.”

This is where the Marie Kondo analogy kicks in.  As you start your migration to the cloud (or to your Data Lake, which may or may not be in the cloud), you decide “this would be a good time to catalog all this stuff.”  You launch into a project with the zeal of a Property and Evidence Technician at a crime scene. “Let’s careful identify and tag every piece of evidence.”  The advantage that they have, and you don’t is that their world is finite.   You are faced with cataloging billions of pieces of metadata.  You know you can’t do it alone, so you implore the people who are putting the data in the Data Swamp (er, Lake).  You mandate that anything that goes into the lake must have a complete catalog.  Pretty soon you notice, that the people putting the data in don’t know what it is either.  And they know most of it is crap, but there are a few good nuggets in there.  If you require them to have descriptions of each data element, they will copy the column heading and call it a description.

Let’s just say, hypothetically, you succeeded in getting a complete and decent catalog for all the datasets in use in your enterprise.  Now what?

Click here to read more on TDAN.com

The Flagging Art of Saying Nothing

Who doesn’t like a nice flag? Waving in the breeze, reminding us of who we are and what we stand for. Flags are a nice way of providingUnderstanding Meaning in Data a rallying point around which to gather and show our colors to the world. They are a way of showing membership in a group, or providing a warning. Which is why it is so unfortunate when we find flags in a data management system, because they are reduced to saying nothing. Let me explain.

When we see Old Glory, we instantly know it is emblematic of the United States. We also instantly recognize the United Kingdom’s emblematic Union Jack and Canada’s Maple Leaf Flag. Another type of flag is a Warning flag alerting us to danger. In either case, we have a clear reference to what the flag represents. How about when you look at a data set and see ‘Yes’, or ‘7’? Sure, ‘Yes’ is a positive assertion and 7 is a number, but those are classifications, not meaning. Yes what? 7 what? There is no intrinsic meaning in these flags. Another step is required to understand the context of what is being asserted as ‘Yes’. Numeric values have even more ambiguity. Is it a count of something, perhaps 7 toasters? Is it a ranking, 7th place? Or perhaps it is just a label, Group 7?

In data systems the number of steps required to understand a value’s meaning is critical both for reducing ambiguity, and, more importantly, for increasing efficiency. An additional step to understand that ‘Yes’ means ‘needs review’, so the processing steps have doubled to extract its meaning. In traditional systems, the two-step flag dance is required because two steps are required to capture the value. First a structure has to be created to hold the value, the ‘Needs Review’ column. Then a value must be placed into that structure. More often than not, an obfuscated name like ‘NdsRvw’ is used which requires a third step to understand what that means. Only when the structure is understood can the value and meaning the system designer was hoping to capture be deciphered.

In cases where what value should be contained in the structure isn’t known, a NULL value is inserted as a placeholder. That’s right, a value literally saying nothing. Traditional systems are built as structure first, content second. First the schema, the structure definition, gets built. Then it is populated with content. The meaning of the content may or may not survive the contortions required to stuff it into the structure, but it gets stuffed in anyway in the hope it can deciphered later when extracted for a given purpose. Given situations where there is a paucity of data, there is a special name for a structure that largely says nothing – sparse tables. These are tables known to likely contain only a very few of the possible values, but the structure still has to be defined before the rare case values actually show up. Sparse tables are like requiring you to have a shoe box for every type of shoe you could possibly ever own even though you actually only own a few pair.

Structure-first thinking is so embedded in our DNA that we find it inconceivable that we can manage data without first building the structure. As a result, flag structures are often put in to drive system functionality. Logic then gets built to execute the flag dance and get executed every time interaction with the data occurs. The logic says something like this:
IF this flag DOESN’T say nothing
THEN do this next thing
OTHERWISE skip that next step
OR do something else completely.
Sadly, structure-first thinking requires this type of logic to be in place. The NULL placeholders are a default value to keep the empty space accounted for, and there has to be logic to deal with them.

Semantics, on the other hand, is meaning-first thinking. Since there is no meaning in NULL, there is no concept of storing NULL. Semantics captures meaning by making assertions. In semantics we write code that says “DO this with this data set.” No IF-THEN logic, just DO this and get on with it. Here is an example of how semantics maintains the fidelity of our information without having vacuous assertions.

The system can contain an assertion that the Jefferson contract is categorized as ‘Needs Review’ which puts it into the set of all contracts needing review. It is a subset of all the contracts. The rest of the contracts are in the set of all contracts NOT needing review. These are separate and distinct sets which are collectively the set of all contracts, a third set. System functionality can be driven by simply selecting the set requiring action, the “Needs Review” set, the set that excludes those that need review, or the set of all contracts. Because the contracts requiring review are in a different set, a sub-set, and it was done with a single step, the processing logic is cut in half. Where else can you get a 50% discount and do less work to get it?

I love a good flag, but I don’t think they would have caught on if we needed to ask the flag-bearer what the label on the flagpole said to understand what it stood for.

Blog post by Mark Ouska 

For more reading on the topic, check out this post by Dave McComb.

The Data-Centric Revolution: Lawyers, Guns and Money

My book “The Data-Centric Revolution” will be out this summer.  I will also be presenting at Dataversity’s Data Architecture Summit coming up in a fewThe Data-Centric Revolution months.  Both exercises reminded me that Data-Centric is not a simple technology upgrade.  It’s going to take a great deal more to shift the status quo.

Let’s start with Lawyers, Guns and Money, and then see what else we need.

A quick recap for those who just dropped in: The Data-Centric Revolution is the recognition that maintaining the status quo on enterprise information system implementation is a tragic downward spiral.  Almost every ERP, Legacy Modernization, MDM, or you name it project is coming in at ever higher costs and making the overall situation worse.

We call the status quo the “application-centric quagmire.”  The application-centric aspect stems from the observation that many business problems turn into IT projects, most of which end up with building, buying, or renting (Software as a Service) a new application system.  Each new application system comes with its own, arbitrarily different data model, which adds to the pile of existing application data models, further compounding the complexity, upping the integration tax, and inadvertently entrenching the legacy systems.

The alternative we call “data-centric.”  It is not a technology fix.  It is not something you can buy.  We hope for this reason that it will avoid the fate of the Gartner hype cycle.  It is a discipline and culture issue.  We call it a revolution because it is not something you add to your existing environment; it is something you do with the intention of gradually replacing your existing environment (recognizing that this will take time.)

Seems like most good revolutions would benefit from the Warren Zevon refrain: “Send lawyers, guns, and money.”  Let’s look at how this will play out in the data-centric revolution.

Click here to read more on TDAN.com

The 1st Annual Data-Centric Architecture Forum: Re-Cap

In the past few weeks, Semantic Arts, hosted a new Data-Centric Architecture Forum.  One of the conclusions made by the participants was that it wasn’t like a traditional conference.  This wasn’t marching from room to room to sit through another talking head and PowerPoint lead presentation. There were a few PowerPoint slides that served to anchor, but it was much more a continual co-creation of a shared artifact.

The agreed consensus was:

  • — Yes, let’s do it again next year.
  • — Let’s call it a forum, rather than a conference.
  • — Let’s focus on implementation next year.
  • — Let’s make it a bit more vendor-friendly next year.

So retrospectively, last week was the first annual Data-Centric Architecture Forum.

What follows are my notes and conclusions from the forum.

Shared DCA Vision

I think we came away with a great deal of commonality and more specifics on what a DCA needs to look like and what it needs to consist of. The straw-man (see appendix A) came through with just a few revisions (coming soon).  More importantly, it grounded everyone on what was needed and gave a common vocabulary about the pieces.

Uniqueness

I think with all the brain power in the room and the fact that people have been looking for this for a while, after we had described what such a solution entailed, if anyone knew of a platform or set of tools that provided all of this, out of the box, they would have said so.

I think we have outlined a platform that does not yet exist and needs to.  With a bit of perseverance, next year we may have a few partial (maybe even more than partial) implementations.

Completeness

After working through this for 2 ½ days, I think if there were anything major missing, we would have caught it.  Therefore, this seems to be a pretty complete stack. All the components and at least a first cut as to how they are related seems to be in place.

Doable-ness

While there are a lot of parts in the architecture, most of the people in the room thought that most of the parts were well-known and doable.

This isn’t a DARPA challenge to design some state-of-the-art thing, this is more a matter of putting pieces together that we already understand.

Vision v. Reference Architecture

As noted right at the end, this is a vision for an architecture— not a specific architecture or a reference architecture.

Notes From Specific Sessions

DCA Strawman

Most of this is covered was already covered above.  I think we eventually suggested that “Analytics” might deserve its own layer.  You could say that analytics is a “behavior” but it seems to be burying the lead.

I also thought it might be helpful to have some of the specific key APIs that are suggested by the architecture, and it looks like we need to split the MDM style of identity management from user identity management for clarity, and also for positioning in the stack.

State of the Industry

There is a strong case to be made that knowledge graph driven enterprises are eating the economy.  Part of this may be because network effect companies are sympathetic with network data structures.  But we think the case can be made so that the flexibility inherent in KGs applies to companies in any industry.

According to research that Alan provided, the average enterprise now executes 1100 different SaaS services.  This is fragmenting the data landscape even faster than legacy did.

Business Case

A lot of the resistance isn’t technical, but instead tribal.

Even within the AI community there are tribes with little cross-fertilization:

  • Symbolists
  • Bayesians
  • Statisticians
  • Connectionists
  • Evolutionaries
  • Analogizers

On the integration front, the tribes are:

  • Relational DB Linkers
  • Application-Centric ESB Advocates
  • Application-Centric RESTful developers
  • Data-centric Knowledge Graphers

Click here to read more on TDAN.com

The Data-Centric Revolution: Chapter 2

The Data-Centric Revolution

Below is an excerpt and downloadable copy of the “Chapter 2: What is Data-Centric?”

CHAPTER 2

What is Data-Centric?

Our position is:

A data-centric enterprise is one where all application functionality is based on a single, simple, extensible data model.

First, let’s make sure we distinguish this from the status quo, which we can describe as an application-centric mindset. Very few large enterprises have a single data model. They have one data model per application, and they have thousands of applications (including those they bought and those they built). These models are not simple. In every case we examined, application data models are at least 10 times more complex than they need to be, and the sum total of all application data models is at least 100-1000 times more complex than necessary.

Our measure of complexity is the sum total of all the items in the schema that developers and users must learn in order to master a system.  In relational technology this would be the number of classes plus the number of all attributes (columns).  In object-oriented systems, it is the number of classes plus the number of attributes.  In an XML or json based system it is the number of unique elements and/or keys.

The number of items in the schema directly drives the number of lines of application code that must be written and tested.  It also drives the complexity for the end user, as each item, eventually surfaces in forms or reports and the user must master what these mean and how the relate to each other to use the system.

Very few organizations have applications based on an extensible model. Most data models are very rigid.  This is why we call them “structured data.”  We define the structure, typically in a conceptual model, and then convert that structure to a logical model and finally a physical (database specific) model.  All code is written to the model.  As a result, extending the model is a big deal.  You go back to the conceptual model, make the change, then do a bunch of impact analysis to figure out how much code must change.

An extensible model, by contrast is one that is designed and implemented such that changes can be added to the model even while the application is in use. Later in this book and especially in the two companion books we get into a lot more detail on the techniques that need to be in place to make this possible.

In the data-centric world we are talking about a data model that is primarily about what the data means (that is, the semantics). It is only secondarily, and sometimes locally, about the structure, constraints, and validation to be performed on the data.

Many people think that a model of meaning is “merely” a conceptual model that must be translated into a “logical” model, and finally into a “physical” model, before it can be implemented. Many people think a conceptual model lacks the requisite detail and/or fidelity to support implementation. What we have found over the last decade of implementing these systems is that done well, the semantic (conceptual) data model can be put directly into production. And that it contains all the requisite detail to support the business requirements.

And let’s be clear, being data-centric is a matter of degree. It is not binary. A firm is data-centric to the extent (or to the percentage) its application landscape adheres to this goal.

Data-Centric vs. Data-Driven

Many firms claim to be, and many firms are, “data-driven.” This is not quite the same thing as data-centric. “Data-driven” refers more to the place of data in decision processes. A non-data-driven company relies on human judgement as the justification for decisions. A data-driven company relies on evidence from data.

Data-driven is not the opposite of data-centric. In fact, they are quite compatible, but merely being data-driven does not ensure that you are data-centric. You could drive all your decisions from data sets and still have thousands of non-integrated data sets.

Our position is that data-driven is a valid aspiration, though data-driven does not imply data-centric. Data-driven would benefit greatly from being data-centric as the simplicity and ease of integration make being data-driven easier and more effective.

We Need our Applications to be Ephemeral

The first corollary to the data-centric position is that applications are ephemeral, and data is the important and enduring asset. Again, this is the opposite of the current status quo. In traditional development, every time you implement a new application, you convert the data to the new applications representation. These application systems are very large capital projects. This causes people to think of them like more traditional capital projects (factories, office buildings, and the like). When you invest $100 Million in a new ERP or CRM system, you are not inclined to think of it as throwaway. But you should. Well, really you shouldn’t be spending that kind of money on application systems, but given that you already have, it is time to reframe this as sunk cost.

One of the ways application systems have become entrenched is through the application’s relation to the data it manages. The application becomes the gatekeeper to the data. The data is a second-class citizen, and the application is the main thing. In data-centric, the data is permanent and enduring, and applications can come and go.

Data-Centric is Designed with Data Sharing in Mind

The second corollary to the data-centric position is default sharing. The default position for application-centric systems is to assume local self-sufficiency. Most relational database systems base their integrity management on having required foreign key constraints. That is, an ordering system requires that all orders be from valid customers. The way they manage this is to have a local table of valid customers. This is not sharing information. This is local hoarding, made possible by copying customer data from somewhere else. And this copying process is an ongoing systems integration tax. If they were really sharing information, they would just refer to the customers as they existed in another system. Some API-based systems get part of the way there, but there is still tight coupling between the ordering system and the customer system that is hosting the API. This is an improvement but hardly the end game.

As we will see later in this book, it is now possible to have a single instantiation of each of your key data types—not a “golden source” that is copied and restructured to the various application consumers, but a single copy that can be used in place.

Is Data-Centric Even Possible?

Most experienced developers, after reading the above, will explain to you why this is impossible. Based on their experience, it is impossible. Most of them have grown up with traditional development approaches. They have learned how to build traditional standalone applications. They know how applications based on relational systems work. They will use this experience to explain to you why this is impossible. They will tell you they tried this before, and it didn’t work.

Further, they have no idea how a much simpler model could recreate all the distinctions needed in a complex business application. There is no such thing as an extensible data model in traditional practice.

You need to be sympathetic and recognize that based on their experience, extensive though it might be, they are right. As far as they are concerned, it is impossible.

But someone’s opinion that something is impossible is not the same as it not being possible. In the late 1400s, most Europeans thought that the world was flat and sailing west to get to the far east was futile. In a similar vein, in 1900 most people were convinced that heavier than air flight was impossible.

The advantage we have relative to the pre-Columbians, and the pre-Wrights is that we are already post-Columbus and post-Wrights. These ideas are both theoretically correct and have already been proved.

The Data-Centric Vision

To fix your wagon to something like this, we need to make a few aspects of the end game much clearer. We earlier said the core of this was the idea of a single, simple, extensible data model. Let’s drill in on this a bit deeper.

Click here to download the entire chapter.

Use the code: SemanticArts for a a 20% discount off of Technicspub.com

Field Report from the First Annual Data-Centric Architecture Conference

Our Data-Centric Architecture conference a couple weeks ago was pretty incredible. I don’t think I’ve ever participated in a single intense, productive conversation with 20 people that lasted 2 1/2 days, with hardly a let up. Great energy, very balanced participation.

And I echo Mark Wallace’s succinct summary on LinkedIn.

I think one thing all the participants agreed on was that it wasn’t a conference, or at least not a conference in the usual sense. I think going forward we will call it the Data-centric Architecture Forum. Seems more fitting.

My summary take away was:

  1. This is an essential pursuit.
  2. There is nothing that anyone in the group (and this is a group with a lot of coverage) knows of that does what a Data-Centric Architecture has to do, out of the box.
  3. We think we have identified the key components. Some of them are difficult and have many design options that are still open, but no aspect of this is beyond the reach of competent developers, and none of the components are even that big or difficult.
  4. The straw-man held up pretty well. It seemed to work pretty well as a communication device. We have a few proposed changes.
  5. We all learned a great deal in the process.

A couple of immediate next steps:

  1. Hold the date, and save some money: We’re doing this again next year Feb 3-5, $225 if you register by April 15th: http://dcc.semanticarts.com.
  2. The theme of next year’s forum will be experience reports on attempting to implement portions of the architecture.
  3. We are going to pull together a summary of points made and changes to the straw-man.
  4. I am going to begin in earnest on a book covering the material covered.

Field Report by Dave McComb

Join us next year!

What will we talk about at the Data-Centric Conference?

“The knowledge graph is the only currently implementable and sustainable way for businesses to move to the higher level of integration needed to make data truly useful for a business.”

data-centric conferenceYou may be wondering what some of our Data-Centric Conference panel topics will actually look like, what the discussion will entail. This article from Forbes is an interesting take on knowledge graphs and is just the kind of thing we’ll be discussing at the Data-Centric Conference.

When we ask Siri, Alexa or Google Home a question, we often get alarmingly relevant answers. Why? And more importantly, why don’t we get the same quality of answers and smooth experience in our businesses where the stakes are so much higher?

The answer is that these services are all powered by extensive knowledge graphs that allow the questions to be mapped to an organized set of information that can often provide the answer we want.

Is it impossible for anyone but the big tech companies to organize information and deliver a pleasing experience? In my view, the answer is no. The technology to collect and integrate data so we can know more about our businesses is being delivered in different ways by a number of products. Only a few use constructs similar to a knowledge graph.

But one company I have been studying this year, Cambridge Semantics, stands out because it is focused primarily on solving the problems related to creating knowledge graphs that work in businesses. Cambridge Semantics technology is powered by AnzoGraph, its highly scalable graph database, and uses semantic standards, but the most interesting thing to me is how the company has assembled all the elements needed to create a knowledge graph factory.  Because in business we are going to need many knowledge graphs that can be maintained and evolved in an orderly manner.

Read more here: Is The Enterprise Knowledge Graph Finally Going To Make All Data Usable?

Register for the conference here.

P.S. The Early Bird Special for Data-Centric Conference registration runs out 12/31/18.