Get the gist: start building simplicity now

While organizing data has always been important, a noticeably profound interest in optimizing information models with Semantic Knowledge graphs has arisen.  LinkedIn, AirBnB, in addition to giants Google and Amazon use graphs, but without a model for connecting concepts with rules for membership buyer recommendations and enhanced searchability (follow your nose) capabilities would lack accuracy.
Drum roll please … Introduce the ontology.
It is a model that supports semantic knowledge graph reasoning, inference, and provenance enablement.  Think of an ontology as the brain giving messages to the nervous systems (the knowledge graph).  An ontology organizes data into well-defined categories with clearly defined relationships.  This model represents a foundational starting point that allows humans and machines to read, understand, and infer knowledge based on its classification.  In short, this automatically figures out what is similar and what is different.
We’re asked often, where do I start?
Enter ‘gist’ a minimalist business ontology (model) to springboard transitioning information into knowledge.  With more than a decade of refinement grounded in simplicity, ‘gist’ is designed to have the maximum coverage of typical business ontology concepts with the fewest number of primitives and least amount of ambiguity.  ‘gist’ is available for free under a Creative Commons license and is being applied and extended within a number of business use cases and utilized by countless industries.
Recently, senior Ontologist Michael Uschold has been sharing an introductory overview of ‘gist’, maintained by Semantic Arts.
One compelling difference from most publicly available ontologies, ‘gist’ has an active governance and best practices community, called the gist Council. The council meets virtually on the first Thursday of every month to discuss how to use ‘gist’ and make suggestions on its evolution.
See Part I of Michael’s introduction here:

See Part II of Michael’s introduction here:

Stay tuned for the final installment!

Interested in gist? Visit Semantic Arts – gist

See more informative videos on Semantic Arts – YouTube

The Data-Centric Revolution: Headless BI and the Metrics Layer

Read more from Dave McComb in his recent article on The Data Administration Newsletter.

“The data-centric approach to metrics puts the definition of the metrics in the shared data. Not in the BI tool, not in code in an API. It’s in the data, right along with the measurement itself.”

Link: The Data-Centric Revolution: Headless BI and the Metrics Layer – TDAN.com

Read more of Dave’s articles: mccomb – TDAN.com

How to SPARQL with tarql

To load existing data into a knowledge graph without writing code, try using the tarql program. Tarql takes comma-separated values (csv) as input, so if you have a way to put your existing data in csv format, you can then use tarql to convert the data to semantic triples ready to load into a knowledge graph. Often, the data starts off as a tab in an Excel spreadsheet, which can be saved as a file of comma-separated values.

This blog post is for anyone familiar with SPARQL who wants to get started using tarql by learning a simple three-step process and seeing enough examples to feel confident about applying it.

Why SPARQL? Because tarql gets its instructions for how to convert csv data to triples via SPARQL statements you write. Tarql reads one row of data at a time and converts it to triples; by default the first row of the comma-separated values is interpreted to be variables, and subsequent rows are interpreted to be data.

Here are three steps to writing the SPARQL:

1. Understand your csv data and write down what one row should be converted to.
2. Use a SPARQL CONSTRUCT clause to define the triples you want as output.
3. Use a SPARQL WHERE clause to convert csv values to output values.

That’s how to SPARQL with tarql.

Example:

1. Review the data from your source; identify what each row represents and how the values in a row are related to the subject of the row.

In the example, each row includes information about one employee, identified by the employee ID in the first column. Find the properties in your ontology that will let you relate values in the other columns to the subject.

Then pick one row and write down what you want the tarql output to look like for the row. For example:

exd:_Employee_802776 rdf:type ex:Employee
ex:name “George L. Taylor” ;
ex:hasSupervisor exd:_Employee_960274 ;
ex:hasOffice “4B17” ;
ex:hasWorkPhone “906-555-5344” ;
ex:hasWorkEmail “[email protected]” .

The “ex:” in the example is an abbreviation for the namespace of the ontology, also known as a prefix for the ontology. The “exd:” is a prefix for data that is represented by the ontology.

2. Now we can start writing the SPARQL that will produce the output we want. Start by listing the prefixes needed and then write a CONSTRUCT statement that will create the triples. For example:

prefix ex: <https://ontologies.company.com/examples/>
prefix exd: <https://data.company.com/examples/>
prefix rdf: <http://www.w3.org/1999/02/22-rdf-syntax-ns#>
prefix xsd: <http://www.w3.org/2001/XMLSchema#>

construct {
?employee_uri rdf:type ex:Employee ;
ex:name ?name_string ;
ex:hasSupervisor ?supervisor_uri ;
ex:hasOffice ?office_string ;
ex:hasWorkPhone ?phone_string ;
ex:hasWorkEmail ?email_string .
}

Note that the variables in the CONSTRUCT statement do not have to match variable names in the spreadsheet. We included the type (uri or string) in the variable names to help make sure the next step is complete and accurate.

3. Finish the SPARQL by adding a WHERE clause that defines how each variable in the CONSTRUCT statement is assigned its value when a row of the csv is read. Values get assigned to these variables with SPARQL BIND statements.

If you read tarql documentation, you will notice that tarql has some conventions for converting the column headers to variable names. We will override those to simplify the SPARQL by inserting our own variable names into a new row 1, and then skipping the original values in row 2 as the data is processed.

Here’s the complete SPARQL script:

prefix ex: <https://ontologies.company.com/examples/>
prefix exd: <https://data.company.com/examples/>
prefix rdf: <http://www.w3.org/1999/02/22-rdf-syntax-ns#>
prefix xsd: <http://www.w3.org/2001/XMLSchema#>

construct {
?employee_uri rdf:type ex:Employee ;
ex:name ?name_string ;
ex:hasSupervisor ?supervisor_uri ;
ex:hasOffice ?office_string ;
ex:hasWorkPhone ?phone_string ;
ex:hasWorkEmail ?email_string .
}

where {
bind (xsd:string(?name) as ?name_string) .
bind (xsd:string(?office) as ?office_string) .
bind (xsd:string(?phone) as ?phone_string) .
bind (xsd:string(?email) as ?email_string) .

bind(str(tarql:expandPrefix(“ex”)) as ?exNamespace) .
bind(str(tarql:expandPrefix(“exd”)) as ?exdNamespace) .

bind(concat(“_Employee_”, str(?employee)) as ?employee_string) .
bind(concat(“_Employee_”, str(?supervisor)) as ?supervisor_string) .

bind(uri(concat(?exdNamespace, ?employee_string)) as ?employee_uri) .
bind(uri(concat(?exdnamespace, ?supervisor_string))as ?supervisor_uri) .

# skip the row you are not using (original variable names)
filter (?ROWNUM != 1) # ROWNUM must be in capital letters
}

And here are the triples created by tarql:

exd:_Employee_802776 rdf:type ex:Employee ;
ex:name “George L. Taylor” ;
ex:hasOffice “4B17” ;
ex:hasWorkPhone “906-555-5344” ;
ex:hasWorkEmail “[email protected]” .

exd:_Employee_914053 rdf:type ex:Employee ;
ex:name “Amy Green” ;
ex:hasOffice “3B42” ;
ex:hasWorkPhone “906-555-8253” ;
ex:hasWorkEmail “[email protected]” .

exd:_Employee_426679 rdf:type ex:Employee ;
ex:name “Constance Hogan” ;
ex:hasOffice “9C12” ;
ex:hasWorkPhone “906-555-8423” .

If you want a diagram of the output, try this tool for viewing triples.

Now that we have one example worked out, let’s review some common situations and SPARQL statements to deal with them.

To remove special characters from csv values:

replace(?variable, ‘[^a-zA-Z0-9]’, ‘_’)

To cast a date as a dateTime value:

bind(xsd:dateTime(concat(?date, ‘T00:00:00’)) as ?dateTime)

To convert yes/no values to meaningful categories (or similar conversions):

bind(if … )

To split multi-value fields:

apf:strSplit(?variable ‘,’)

Another really important point is that data extracts in csv format typically do not contain URIs (the unique permanent IDs that allow triples to “snap together” in the graph). When working with multiple csv files, make sure to keep track of how you are creating the URI for each type of instance and always use exactly the same method across all of the sources.

Practical tip: name files to make them easy to find, for example:

employee.csv
employee.tq SPARQL script containing instructions for tarql
employee.sh shell script with the line “tarql employee.tq employee.csv”

Excel tip: to save an Excel sheet as csv use Save As / Comma Separated Values (csv).

So there it is, a simple three-step method for writing the SPARQL needed to convert comma-separated values to semantic triples. The beauty of it is that you don’t need to write code, and since you need to use SPARQL for querying triple stores anyway, there’s only a small additional learning curve to use it for tarql.

Special thanks to Michael Uschold and Dalia Dahleh for their excellent input.

For more examples and more options, see the nice writeup by Bob DuCharme or refer to the tarql site.

Incremental Stealth Legacy Modernization

I’m reading the book Kill it with Fire by Marianne Bellotti. It is a delightful book. Plenty of pragmatic advice, both on the architectural side (how to think through whether and when to break up that monolith) and the organizational side (how to get and maintain momentum for what are often long, drawn-out projects). So far in my reading she seems to advocate incremental improvement over rip and replace, which is sensible, given the terrible track record with rip and replace. Recommended reading for anyone who deals with legacy systems (which is to say anyone who deals with enterprise systems, because a majority are or will be legacy systems).

But there is a better way to modernize legacy systems. Let me spoil the suspense: it is Data-Centric. We are calling it Incremental Stealth Legacy Modernization because no one is going to get the green light to take this on directly. This article is for those playing the long game.

Legacy Systems

Legacy is the covering concept for a wide range of activities involving aging enterprise systems. I had the misfortune of working in Enterprise IT just as the term “Legacy” became pejorative. It was the early 1990’s, we were just completing a long-term strategic plan for John’s Manville. We decided to call it the “Legacy Plan” as we thought those involved with it would leave a legacy to those who came after. The ink had barely dried when “legacy” acquired a negative connotation. (While writing this I just looked it up, and Wikipedia thinks the term had already acquired its negative connotation in the 1980’s. Seems to me if it were in widespread use someone would have mentioned it before we published that report).

There are multiple definitions of what makes something a legacy system. Generally, it refers to older technology that is still in place and operating. What tends to keep legacy systems in place are networks of complex dependencies. A simple stand-alone program does not become a legacy system, because when the time comes, it can easily be rewritten and replaced. Legacy systems have hundreds or thousands of external dependencies, that often are not documented. Removing, replacing, or even updating legacy systems runs the risk of violating some of those dependencies. It is the fear of this disruption that keeps most legacy systems in place. And the longer it stays in place the more dependencies it accretes.

If these were the only forces affecting legacy systems, they would stay in place forever. The countervailing forces are obsolescence, dis-economy, and risk. While many parts of the enterprise depend on the legacy systems, the legacy system itself has dependencies. The system is dependent on operating systems, programming languages, middleware, and computer hardware. Any of these dependencies can and do become obsolescent and eventually obsolete. Obsolete components are no longer supported and therefore represent a high degree of risk of total failure of the system. The two main dimensions of dis-economy are operations and change. A modern system can typically run at a small fraction of the operating costs of a legacy system, especially when you tally up all the licenses for application systems, operating systems and middleware and add in salary costs for operators and administrators to support. The dis-economy of change is well known coming in the form of integration debt. Legacy systems are complex and brittle which makes change hard. The cost to make even the smallest changes to a legacy system are orders of magnitude more than the cost to make a similar change to a modern well-designed system. They are often written in obscure languages. One of my first legacy modernization projects involved replacing a payroll system written in assembler language with one that was to be written in “ADPAC.” You can be forgiven for thinking it is insane to have written a payroll system in assembler language, and even more so for replacing with a system written in a language that no one in the 21st century has heard of, but this was a long time ago, and is indicative of where legacy systems come from.

Legacy Modernization

Eventually the pressure to change overwhelms the inertia to leave things as they are. This usually does not end well for several reasons. Legacy modernization is usually long delayed. There is not a compelling need to change, and as a result for most of the life of a legacy systems resources have been assigned to other projects that get short term net positive returns. Upgrading the legacy system represents low upside. The new legacy system will do the same thing the old legacy system did, perhaps a bit cheaper or a bit better, but not fundamentally differently. Your old payroll system is paying everyone, and so will a new one.

As a result, the legacy modernization project is delayed as long as possible. When the inevitable precipitating event occurs, the replacement becomes urgent. People are frustrated with the old system. Replacing the legacy system with some more modern system seems like a desirable thing to do. Usually this involves replacing an application system with a package, as this is the easiest project to get approved. These projects were called “Rip and Replace” until the success rate of this approach plummeted. It is remarkable how expensive these projects are and how frequently they fail. Each failure further entrenches the legacy system and raises the stakes for the next project.

Ms. Bellotti points out in Kill it with Fire, many times the way to go is incremental improvement. By skillfully understanding the dependencies, and engineering decoupling techniques, such as APIs and intermediary data sets, it is possible to stave off some of the highest risk aspects of the legacy system. This is preferably to massive modernization projects that fail but, interestingly, has its own downsides: major portions of the legacy system continue to persist, and as she points out, few developers want to sign on to this type of work.

We want to outline a third way.

The Lost Opportunity

After a presentation on Data-Centricity someone in the audience pointed out that data-warehousing represented a form of Data-Centricity. Yes, in a way it does. With Data Warehousing and more recently Data Lakes and Data Lake houses, you have taken a subset of the data from numerous data silos and put it in one place for easier reporting. Yes, this captures a few of the data-centric tenets.

But what a lost opportunity. Think about it, we have spent the last 30 years setting up ETL pipelines and gone through several generations of data warehouses (from Kimball / Inmon roll your own to Teradata, Netezza to Snowflake and dozens more along the way) but have not gotten one inch closer to replacing any legacy systems. Indeed, the data warehouse is entrenching the legacy systems deeper by being dependent on them for their source of data. The industry has easily spent hundreds of billions of dollars, maybe even trillions of dollars over the last several decades, on warehouses and their ecosystems, but rather than getting us closer to legacy modernization we have gotten further from it.

Why no one will take you seriously

If you propose replacing a legacy system with a Knowledge Graph you will get laughed out of the room. Believe me, I’ve tried. They will point out that the legacy systems are vastly complex (which they are), have unknowable numbers of dependent systems (they do), the enterprise depends on their continued operation for its very existence (it does) and there are few if any reference sites of firms that have done this (also true). Yet, this is exactly what needs to be done, and at this point, it is the only real viable approach to legacy modernization.

So, if no one will take you seriously, and therefore no one will fund you for this route to legacy modernization, what are you to do? Go into stealth mode.

Think about it: if you did manage to get funded for a $100 million legacy replacement project, and it failed, what do you have? The company is out $100 million, and your reputation sinks with the $100 million. If instead you get approval for a $1 Million Knowledge Graph based project that delivers $2 million in value, they will encourage you to keep going. Nobody cares what the end game is, but you.

The answer then, is incremental stealth.

Tacking

At its core, it is much like sailing into the wind. You cannot sail directly into the wind. You must tack, and sail as close into the wind as you can, even though you are not headed directly towards your target. At some point, you will have gone far to the left of the direct line to your target, and you need to tack to starboard (boat speak for “right”). After a long starboard tack, it is time to tack to port.

In our analogy, taking on legacy modernization directly is sailing directly into the wind. It does not work. Incremental stealth is tacking. Keep in mind though, just incremental improvement without a strategy is like sailing with the wind (downwind): it’s fun and easy, but it takes you further from your goal, not closer.

The rest of this article are what we think the important tacking strategy should be for a firm that wants to take the Data-Centric route to legacy modernization. We have several clients that are on the second and third tack in this series.

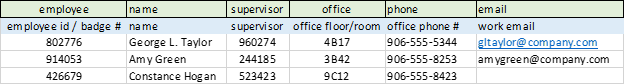
I’m going to use a hypothetical HR / Payroll legacy domain for my examples here, but they apply to any domain.

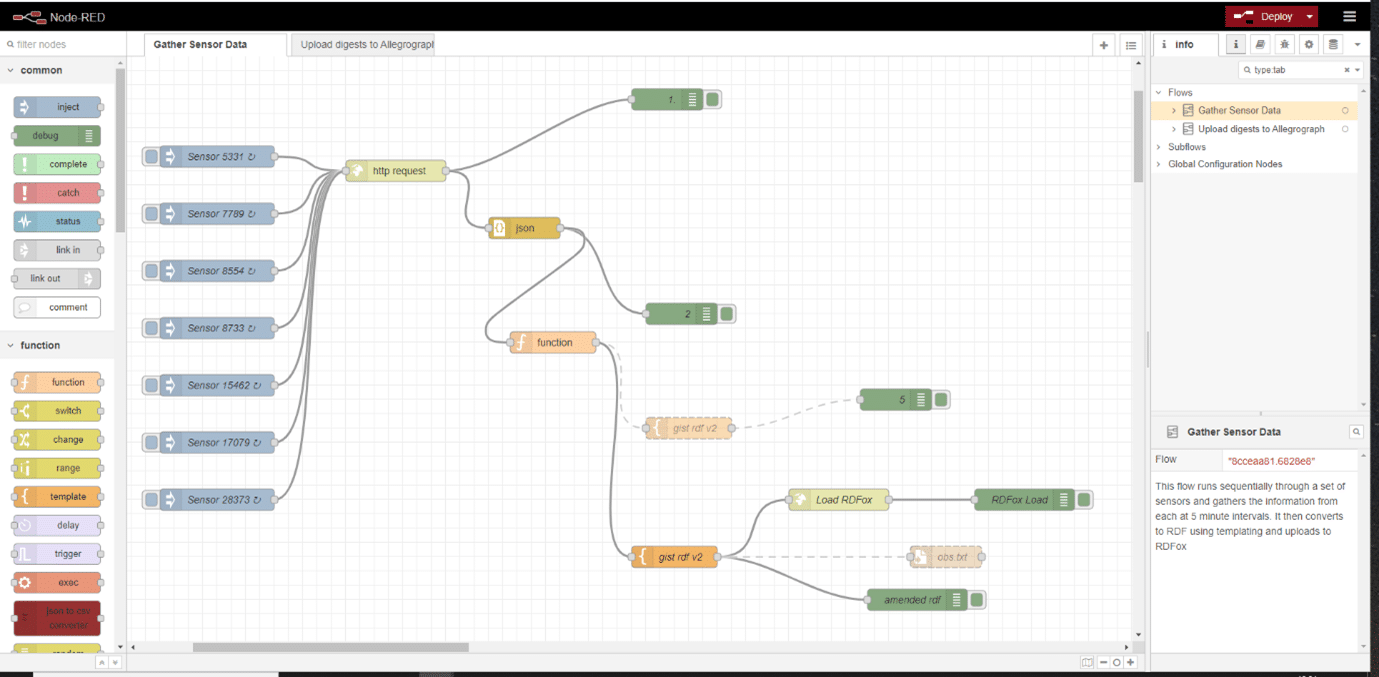
Leg 1 – ETL to a Graph

The first tack is the simplest. Just extract some data from legacy systems and load it into a Graph Database. You will not get a lot of resistance to this, as it looks familiar. It looks like yet another data warehouse project. The only trick is getting sponsors to go this route instead of the tried-and-true data warehouse route. The key enablers here are to find problems well suited to graph structures, such as those that rely on graph analytics or shortest path problems. Find data that is hard to integrate in a data warehouse, a classic example is integrating structured data with unstructured data, which is nearly impossible in traditional warehouses, and merely tricky in graph environments.

The only difficulty is deciding how long to stay on this tack. As long as each project is adding benefit, it is tempting to stay on this tack for a long, long time. We recommend staying this course at least until you have a large subset of the data in at least one domain in the graph while refreshing frequently.

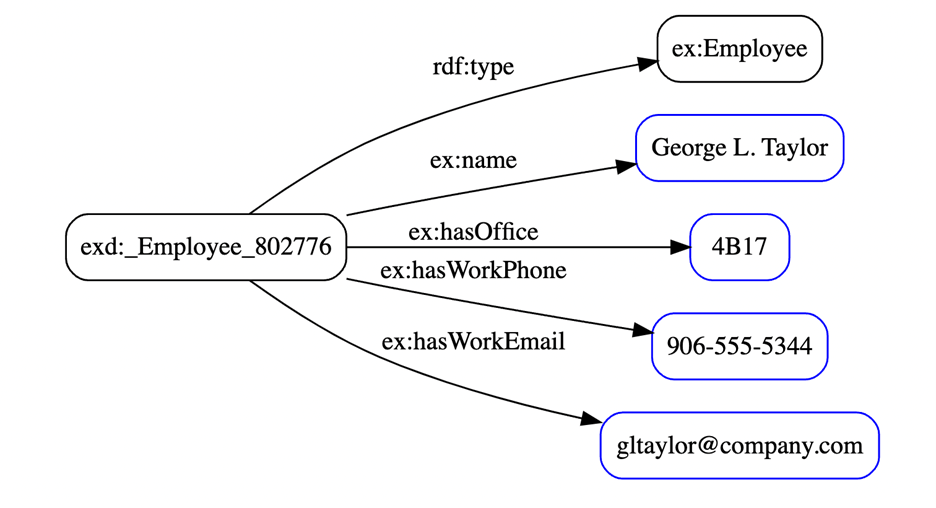
Let’s say after being on this tack for a long while you have all the key data on all your employees in the graph and being updated frequently

Leg 2 – Architecture MVP

On the first leg of the journey there are no updates being made directly to the graph. Just as in a data warehouse: no one makes updates in place in the data warehouse. It is not designed to handle that, and it would mess with everyone’s audit trails.

But a graph database does not have the limitations of a warehouse. It is possible to have ACID transactions directly in the graph. But you need a bit of architecture to do so. The challenge here is crating just enough architecture to get through your next tack. It depends a lot on what you think your next tack will be as to where you start. You’ll need constraint management to make sure your early projects are not loading invalid data back into your graph. Depending on the next tack you may need to implement fine grained security.

Whatever you choose, you will need to build or buy enough architecture to get your first update in place functionality going.

Leg 3 — Simple new Functionality in the Graph

In this leg we begin building update in place business use cases. We recommend not trying to replace anything yet. Concentrate on net new functionality. Some of the current best places to start are maintaining reference data (common shared data such as country codes, currencies, and taxonomies) and/ or some meta data management. Everyone seems to be doing data cataloging projects these days, they could just as well be done in the graph and give you experience and working through learning this new paradigm.

The objective here is to spend enough time on this tack that developers become comfortable with the new development paradigm. Coding directly to graph involves new libraries and new patterns.

Optionally, you may want to stay on this tack long enough to build “model driven development” (low code / no code in Gartner speak) capability into the architecture. The objective of this effort is to drastically reduce the cost of implementing new functionality in future tacks. Comparing before and after metrics on reduced code development, code testing, and code defects to make the case for the innovative approach will be alarming. Or you could leave model driven to a future tack.

Using the payroll / HR example, it will add new functionality dependent on HR data, but other things are not dependent on it. Maybe you built a skills database, or a learning management system. It depends on what is not yet in place that can be purely additive. These are the good places to start demonstrating business value.

Leg 4 – Understand the Legacy System and its Environment

Eventually you will get good at this and want to replace some legacy functionality. Before you do it will behoove you to do a bunch of deep research. Many legacy modernization attempts have run aground from not knowing what they did not know.

There are three things that you don’t fully know at this point:

• What data is the legacy system managing
• What business logic is the legacy system delivering
• What systems are dependent on the legacy system, and what is the nature of those dependencies.
If you have done the first three tacks well, you will have all the important data from the domain in the graph. But you will not have all the data. In fact, at the meta data level, it will appear that you have the tiniest fraction of the data. In your Knowledge Graph you may have populated a few hundred classes and used a few hundred properties, but your legacy system has tens of thousands of columns. By appearances you are missing a lot. What we have discovered anecdotally but have not proven yet, is that legacy systems are full of redundancy and emptiness. You will find that you do have most of the data you need, but before you proceed you need to prove this.

We recommend data profiling using software from a company such as GlobalIDs, IoTahoe or BigID. This software reads all the data in the legacy system and profiles it. It discovers patterns and creates histograms, which reveal where the redundancy is. More importantly, you can find data that is not in the graph and have a conversation about whether it is needed. A lot of data in legacy systems are accumulators (YTD, MTD etc.) that can easily be replaced by aggregation functions, processing flags that are no longer needed, and vast number of fields that are no longer used but both business and IT are afraid to let go. This will provide that certainty.

Another source of fear is “business logic” hidden in the legacy system. People fear that we do not know all of what the legacy system is doing and turning it off will break something. There are millions of lines of code in that legacy system, surely it is doing something useful. Actually, it is not. There is remarkably little essential business logic in most legacy systems. I know as I’ve built complex ERP systems and implemented many packages. Most of this code is just moving data from the database to an API, or to a transaction to another API, or into a conversational control record, or to the DOM if it is a more modern legacy system, onto the screen and back again. There is a bit of validation sprinkled throughout which some people call “business logic” but that is a stretch, it’s just validation. There is some mapping (when the user selects “Male” in the drop down put “1” in the gender field). And occasionally there is a bit of bona fide business logic. Calculating economic order quantities, critical paths or gross to net payroll calculations are genuine business logic. But they represent far less than 1% of the code base. The value is to be sure you have found them and insert into the graph.

This is where reverse engineering or legacy understanding software plays a vital role. Ms. Bellotti is 100% correct on this point as well. If you think these reverse engineer systems are going to automate your legacy conversion, you are in for a world of hurt. But what they can do is help you find the genuine business logic and provide some comfort to the sponsors that there isn’t something important that the legacy system is doing that no one knows about.

The final bit of understanding is the dependencies. This is the hardest one to get complete. The profiling software can help. Some can detect when the histogram of social security numbers in system A changes and the next day the same change is seen in system B, therefore it must be an interface. But beyond this the best you can do is catalog all the known data feeds and APIs. These are the major mechanisms that other systems use to become dependent on the legacy system. You will need to have strategies to mimic these dependencies to begin the migration.

This tack is purely research, and therefore does not develop any perceived immediate gain. You may need to bundle it with some other project that is providing incremental value to get it funded or you may fund it via contingency budget.

Leg 5 – Become the System of Record for some subset

Up to this point, data has been flowing into the graph from the legacy system or originating directly in the graph.

Now it is time to begin the reverse flow. We need to find an area where we can begin the flow going in the other direction. We now have enough architecture to build and answer use cases in the graph, it is time to start publishing rather than subscribing.

It is tempting to want to feed all the data back to the legacy system, but the legacy system has lots of data we do not want to source. Furthermore, this entrenches deeper into the legacy system. We need to pick off small areas that could decommission part of the legacy system.

Let’s say there was a certificate management system in the legacy system. We replace this with a better one in the graph and quit using the legacy one. But from our investigation above, we realize that the legacy certificate management system was feeding some points to the compensation management system. We just make sure the new system can feed the compensation system those points.

Leg 6 – Replace the dependencies incrementally

Now the flywheel is starting to turn. Encouraged by the early success of the reverse flow, the next step is to work out the data dependencies in the legacy system and work out a sequence to replace them.

The legacy payroll system is dependent on the benefit elections system. You now have two choices. You could replace the benefits system in the Graph. Now you will need to feed the results of the benefit elections (how much to deduct for the health care options etc.) to the legacy system. This might be the easier of the two options.

But the one that has the most impact is the other. Replace the payroll system. You have the benefits data feeding into the legacy system. If you replace the payroll system, there is nothing else (in HR) you need to feed. A feed the financial system and the government reporting system will be necessary, but you will have taken a much bigger leap in the legacy modernization effort.

Leg 7 – Lather, Rinse, Repeat

Once you have worked through a few of those, you can safely decommission the legacy system a bit at a time. Each time, pick off an area that can be isolated. Replace the functionality and feed the remaining bits of the legacy infrastructure if necessary. Just stop using that portion of the legacy system. The system will gradually atrophy. No need for any big bang replacement. The risk is incremental and can be rolled back and retried at any point.

Conclusion

We do not go into our clients claiming to be doing legacy modernization, but it is our intent to put them in a position where they could realize over time by applying knowledge graph capabilities.

We all know that at some point all legacy systems will have to be retired. At the moment the state of the art seems to be either “rip and replace” usually putting a packaged application in to replace the incumbent legacy system, or incrementally improve the legacy system in place.

We think there is a risk adverse, predictable, and self-funding route to legacy modernization, and it is done through Data-Centric implementation.

SHACL and OWL

There is a meme floating around out in the internet ether these days: “Is OWL necessary, or can you do everything you need to with SHACL?” We use SHACL most days and OWL every day and we find it quite useful.

It’s a matter of scope. If you limited your scope to replacing individual applications, you could probably get away with just using SHACL. But frankly, if that is your scope, maybe you shouldn’t be in the RDF ecosystem at all. If you are just making a data graph, and not concerned with how it fits into the broader picture, then Neo4j or TigerGraph should give you everything you need, with much less complexity.

If your scope is unifying the information landscape of an enterprise, or an industry / supply chain, and if your scope includes aligning linked open data (LOD), then our experience says OWL is the way to go. At this point you’re making a true knowledge graph.

By separating meaning (OWL) from structure (SHACL) we find it feasible to share meaning without having to share structure. Payroll and HR can share the definition and identity of employees, while sharing very little of their structural representations.

Employing formal definition of classes takes most of the ambiguity out of systems. We have found that leaning into full formal definitions greatly reduces the complexity of the resulting enterprise ontologies.

We have a methodology we call “think big/ start small.” The “think big” portion is primarily about getting a first version of an enterprise ontology implemented, and the “start small” portion is about standing up a knowledge graph and conforming a few data sets to the enterprise ontology. As such, the “think big” portion is primarily OWL. The “start small” portion consists of small incremental extensions to the core model (also in OWL) conforming the data sets to the ontology (TARQL, R2RML, SMS or similar technologies), SHACL to ensure conformance and SPARQL to prove that it all fits together correctly.

For us, it’s not one tool, or one standard, or one language for all purposes. For us it’s like Mr. Natural says, “get the right tool for the job.”

The Data-Centric Revolution: Avoiding the Hype Cycle

Gartner has put “Knowledge Graphs” at the peak of inflated expectations. If you are a Knowledge Graph software vendor, this might be good news. Companies will be buying knowledge graphs without knowing what they are. I’m reminded of an old cartoon of an executive dictating into a dictation machine: “…and in closing, in the future implementing a relational database will be essential to the competitive survival of all firms. Oh, and Miss Smith, can you find out what a relational database is?” I imagine this playing out now, substituting “knowledge graph” for “relational database” and by-passing the misogynistic secretarial pool.

If you’re in the software side of this ecosystem, put some champagne on ice, dust off your business plan, and get your VCs on speed dial. Happy times are imminent.

Oh no! Gartner has put Knowledge Graphs at the peak of the hype cycle for Artificial Intelligence

Those of you who have been following this column know that our recommendations for data-centric transformations strongly encourage semantic technology and model driven development implemented on a knowledge graph. As we’ve said elsewhere, it is possible to become data-centric without all three legs of this stool, but it’s much harder than it needs to be. We find our fate at least partially tethered to the knowledge graph marketplace. You might think we’d be thrilled by the news that is lifting our software brethren’s boats.

But we know how this movie / roller coaster ends. Once a concept scales this peak, opportunists come out of the woodwork. Consultants will be touting their “Knowledge Graph Solutions” application and vendors will repackage their Content Management System or ETL Pipeline product as a key step on the way Knowledge Graph nirvana. Anyone who can spell “Knowledge Graph” will have one to offer.

Some of you will avoid the siren’s song, but many will not. Projects will be launched with great fanfare. Budgets will be blown. What is predictable is that these projects will fail to deliver on their promises. Sponsors will be disappointed. Naysayers will trot out their “I told you so’s.” Gartner will announce Knowledge Graphs are in the Trough of Disillusionment. Opportunists will jump on the next band wagon.

Click here to continue reading on TDAN.com

If you’re interested in Knowledge Graphs, and would like to avoid the trough of disillusionment, contact me: [email protected]

Smart City Ontologies: Lessons Learned from Enterprise Ontologies

Smart City Ontologies: Lessons Learned from Enterprise OntologiesFor the last 20 years,  Semantic Arts has been helping firms design and build enterprise ontologies to get them on the data-centric path. We have learned many lessons from the enterprise that can be applied in the construction of smart city ontologies.

What is similar between the enterprise and smart cities?

  • They both have thousands of application systems. This leads to thousands of arbitrarily different data models, which leads to silos.
  • The enterprise and smart cities want to do agile, BUT agile is a more rapid way to create more silos.

What is different between the enterprise and smart cities?

  • In the enterprise, everyone is on the same team working towards the same objectives.
  • In smart cities there are thousands of different teams working towards different objectives. For example:

Utility companies.
Sanitation companies.
Private and public industry.

  • Large enterprises have data lakes in data warehouses.
  • In smart cities there are little bits of data here and there.

What have we learned?

“Simplicity is the ultimate sophistication.”

20 years of Enterprise Ontology construction and implementation has taught us some lessons that apply to Smart City ontologies. The Smart City Landscape informs us how to apply those lessons, which are:

Think big and start small.

Simplicity is key to integration.

Low code / No code is key for citizen developers.

Semantic Arts gave this talk at the W3c Workshop on Smart Cities originally recorded on June 25, 2021. Click here to view the talks and interactive sessions recorded for this virtual event. A big thank you to W3C for allowing us to contribute!

A Slice of Pi: Some Small Scale Experiments with Sensor Data and Graphs

There was a time when RDF and triplestores were only seen through the lens of massive data integration. Teams went to great extremes to show how many gazillion triples per second their latest development could ingest, and large integrations did likewise with enormous datasets. This was entirely appropriate and resulted in the outstanding engineering achievements that we now rely on daily. However, for this post I would like to look at the other end of the spectrum – the ‘small is beautiful’ end – and I will relate a story about networking tiny, community-based air quality sensors, a Raspberry Pi, low-code orchestration software, and an in-memory triplestore. This is perhaps one of a few blog posts, we’ll have to see. It starts with looking at using graphs at the edge, rather than the behemoth at the centre where this blog started.

The proposition was to see if the sensor data can be brought together through the Node Red low-code/no-code framework to feed the data into RDFox, an in-memory triplestore and then data summaries periodically pushed to a central, larger triplestore. Now, I’m not saying that this is the only way to do this – I’m sure many readers will have their views on how it can be done, but I wanted to see if a minimalist approach was feasible. I also wanted to see if it was rapid and reproducible. Key to developing a broad network of any IoT is the need to scale. What is also needed though is some sort of ‘semantic gateway’ where meaning can be added to what might otherwise be a very terse MQTT or similar feed.

So, let’s have a look for a sensor network to use. I found a great source of data from the Aberdeen Air Quality network (see https://www.airaberdeen.org/ ) led by Ian Watt as part of the Aberdeen ODI and Code The City activities. They are contributing to the global Sensor.Community (formerly Luftdaten) network of air quality sensors. Ian and his associated community have built a handful of small sensors that detect particulate matter in air, the PM10 and PM2.5 categories of particles. These are pollutants that lead to various lung conditions and are generated in exhaust from vehicles, and other combustion and abrasion actions that are common in city environments. Details of how to construct the sensors is given in https://wiki.57north.org.uk/doku.php/projects/air_quality_monitor and https://sensor.community/en/sensors/ . The sensors are all connected to the Sensor.Community (https://sensor.community/en/) project from which their individual JSON data feeds can be polled by a REST call over HTTP(S). These sensors cost about 50 Euros to build, in stark contrast to the tens of thousands of Euros that would be required to provide the large government air quality sensors that are the traditional and official sources of air quality information (http://www.scottishairquality.scot/latest/?la=aberdeen-city) . And yet, despite the cheapness of the device, many studies including those of Prof Rod Jones and colleagues in Cambridge University (https://www.ch.cam.ac.uk/group/atm/person/rlj1001) have found that a wide network of cheap sensors can provide reliable and useful data for air quality monitoring.

So, now that we’ve mentioned Cambridge University we can go on to mention Oxford, and in particular RDFox, the in-memory triplestore and semantic reasoner from Oxford Semantic Technologies (https://www.oxfordsemantic.tech/). In this initial work, we are not using the Datalog reasoning or rapid materialization that this triplestore affords, but instead we stick with the simple addition of triples, and extraction of hourly digests of the data. In fact, RDFox is capable of far more beyond the scope of today’s exercise and much of the process here could be streamlined and handled more elegantly. However, I chose not to make use of these attributes for the sake of showing the simplicity of Node-RED. You might expect this to require a large server, but you’d be wrong – I managed all of it on a tiny Raspberry Pi 4 running the ARM version of Ubuntu. Thanks to Peter Crocker and Diana Marks of Oxford Semantic Technologies for help with the ARM version.

Next up is the glue, pipelining the raw JSON data from the individual sensors into a semantic gateway in which the data will be transformed into RDF triples using the Semantic Arts ‘gist’ ontology (https://www.semanticarts.com/gist/ and https://github.com/semanticarts/gist/releases). I chose to do this using a low-code/no-code solution called Node RED (https://nodered.org/). This framework uses a GUI with pipeline components drawn onto a canvas and linked together by arrows (how very RDF). As the website says, “Node-RED is a programming tool for wiring together hardware devices, APIs and online services in new and interesting ways. It provides a browser-based editor that makes it easy to wire together flows using the wide range of nodes in the palette that can be deployed to its runtime in a single-click.“ This is exactly what we need for this experiment in minimalism. Node-RED provides a wealth of functional modules for HTTP and MQTT calls, templating, decisions, debugging, and so forth. It make it easier to pipeline together a suite of processes to acquire data, transform it, and then push it on to somewhere else than traditional coding. And this ‘somewhere else’ was both the local RPi running RDFox and the Node-RED service, and also a remote instance of RDFox, here operating with disk-based persistence.

Following the threading together of a sequence of API calls to the air sensor endpoints with some templating to an RDF model based on ‘gist’ and uploading to RDFox over HTTP (Figs 1 & 2), the RDFox triplestore can then be queried using a SPARQL CONSTRUCT query to extract a summary of the readings for each sensor on an hourly basis. This summary included the minimum and maximum readings within the hour period for both particle categories (PM10 and PM2.5), for each of the sensors, together with the numbers of readings that were available within that hour period. This was then uploaded to the remote RDFox instance, (Figs 3 & 4) and that store becomes the source of the hourly information for dashboards and the like (Fig 5). Clearly, this approach can be scaled widely by simply adding more Raspberry Pi units.

The code is available from https://github.com/semanticarts/airquality

The experiment worked well. There were minor challenges in getting used to the Node RED framework, and I personally had the challenge of swapping between the dot notation of navigating JSON within Javascript and within the Node RED Mustache templating system. In all, it was a couple of Friday-afternoon experiment sessions, time well spent on an enjoyable starter project.

A Slice of Pi: Some Small Scale Experiments with Sensor Data and Graphs
Fig 1:  The ‘gather sensor data’ flow in Node-RED.


Fig 2: Merging the JSON data from the sensors into an RDF template using Mustache-style templating.


A Slice of Pi: Some Small Scale Experiments with Sensor Data and Graphs
Fig 3: A simple flow to query RDFox on an hourly basis to get digests of the previous hour’s sensor data.


A Slice of Pi: Some Small Scale Experiments with Sensor Data and Graphs
Fig 4: Part of the SPARQL ‘CONSTRUCT’ query that is used to create hourly digests of sensor data to send to the remote persisted RDFox instance.


Fig 5: Querying the RDFox store with SPARQL to see hourly maximum and minimum readings of air pollutants at each of the sensor sites.


Connect with the Author

The Data-Centric Revolution: Fighting Class Proliferation

One of the ideas we promote is elegance in the core data model in a Data-Centric enterprise.  This is harder than it sounds.  Look at most application-centric data models: you would think they would be simpler than the enterprise model, after all, they are a small subset of it.  Yet we often find individual application data models that are far more complex than the enterprise model that covers them.

You might think that the enterprise model is leaving something out, but that’s not what we’re finding when we load data from these systems. We can generally get all the data and all the fidelity in a simpler model.

It behooves us to ask a pretty broad question:

Where and when should I add new classes to my Data-Centric Ontology?

To answer this, we’re going to dive into four topics:

  1. The tradeoff of convenience versus overhead
  2. What is a class, really?
  3. Where is the proliferation coming from?
  4. What options do I have?

Convenience and Overhead

In some ways, a class is a shorthand for something (we’ll get a bit more detailed in the next paragraph). As such, putting a label to it can often be a big convenience. I have a very charming book called, Thing Explainer – Complicated Stuff in Simple Words,[1] by Randall Munroe (the author of xkcd Comics). The premise of Thing Explainer is that even very complex technical topics, such as dishwashers, plate tectonics, the International Space Station, and the Large Hadron Collider, can all be explained using a vocabulary of just ten hundred words. (To give you an idea of the lengths he goes to he uses “ten hundred” instead of one “thousand” to save a word in his vocabulary.)

So instead of coining a new word in his abbreviated vocabulary, “dishwasher” becomes, “box that cleans food holders,” food holders being bowls and plates). I lived in Papua New Guinea part time for a couple of years, and the national language there, Tok Pisin, has only about 2,000 words. They ended up with similar word salads. I remember the grocery store was at “plas bilong san kamup,” or “place belong sun come up,” which is Tok Pisin for “East.”

It is much easier to refer to “dishwashers” and “East” than their longer equivalents. It’s convenient. And it doesn’t cost us much in everyday conversation.

But let’s look at the convenience / overhead tradeoff in an information system that is not data-centric. Every time you add a new class (or a new attribute) to an information system you are committing the enterprise to deal with it potentially for decades to come. The overhead starts with application programming, thatsoftware wasteland new concept has to be referred to by code, and not just a small amount.  I’ve done some calculations in my book, Software Wasteland, that suggests each attribute added to a system adds at least 1,000 lines of source code—code to move the item from the database to some API, code to take it from the API and put it in the DOM or something similar, code to display it on a screen, in a report, maybe even in a drop-down list, code to validate it.  Given that it costs money to write and test code, this is adding to the cost of a system. The real impact is felt downstream, felt in application maintenance, especially felt in the brittle world of systems integration, and it is felt by the users. Every new attribute is a new field on a form to puzzle about. Every new class is often a new form. New forms often require changes to process flow.  And so, the complexity grows.

Finally, there is cognitive load. When we have to deal with dozens or hundreds of concepts, we don’t have too much trouble. When we get to thousands it becomes a real undertaking. Tens of thousands and it’s a career. And yet many individual applications have tens of thousands of concepts. Most large enterprises have millions which is why becoming data-centric is so appealing.

One of the other big overheads in traditional technology is duplication. When you create a new class, let’s say, “hand tools,” you may have to make sure that the wrench is in the Hand Tools class / table and also in the Inventory table. This relying on humans and procedures to remember to put things in more than one place is a huge undocumented burden.

We want to think long and hard before introducing a new class or even a new attribute.

Read more on TDAN.com

Achieving Clarity in your Data Ecosystem

Achieving clarity in your data ecosystem is more difficult than ever these days.

With false news, cyber-attacks, social media, and a consistent blitz of propaganda – how does one sort it all out? Even our data and information practices have suffered from this proliferation (data warehouse, data lake, data fabric, data mesh … this is the short list). Data terminologies emerge like potholes every spring in Minnesota roads (I should know by being a 50 year resident and hitting more than my share).

Disambiguating the different terms (advantages and disadvantages) along with a history on the reasons these have developed and continue to be part of most every organizational data ecosystem was the topic for Dave McComb, founder of Semantic Arts and Dan DeMers, CEO of Cinchy. A conversational style webinar provided great insights and graphics to give needed clarity. Using my prior analogy, it filled some potholes.

Conclusions were that no one solution exists. What did emerge is how things relate to one another, how they are connected with context is vital to business agility, innovation, and ultimately a competitive advantage. Moving away from application centric to more data-centric thinking will inherently get you there faster and with abundantly less technical debt. 50 years of untangling a data mess starts by looking at the challenge with a different, data-centric lens.