The Flagging Art of Saying Nothing

Who doesn’t like a nice flag? Waving in the breeze, reminding us of who we are and what we stand for. Flags are a nice way of providingUnderstanding Meaning in Data a rallying point around which to gather and show our colors to the world. They are a way of showing membership in a group, or providing a warning. Which is why it is so unfortunate when we find flags in a data management system, because they are reduced to saying nothing. Let me explain.

When we see Old Glory, we instantly know it is emblematic of the United States. We also instantly recognize the United Kingdom’s emblematic Union Jack and Canada’s Maple Leaf Flag. Another type of flag is a Warning flag alerting us to danger. In either case, we have a clear reference to what the flag represents. How about when you look at a data set and see ‘Yes’, or ‘7’? Sure, ‘Yes’ is a positive assertion and 7 is a number, but those are classifications, not meaning. Yes what? 7 what? There is no intrinsic meaning in these flags. Another step is required to understand the context of what is being asserted as ‘Yes’. Numeric values have even more ambiguity. Is it a count of something, perhaps 7 toasters? Is it a ranking, 7th place? Or perhaps it is just a label, Group 7?

In data systems the number of steps required to understand a value’s meaning is critical both for reducing ambiguity, and, more importantly, for increasing efficiency. An additional step to understand that ‘Yes’ means ‘needs review’, so the processing steps have doubled to extract its meaning. In traditional systems, the two-step flag dance is required because two steps are required to capture the value. First a structure has to be created to hold the value, the ‘Needs Review’ column. Then a value must be placed into that structure. More often than not, an obfuscated name like ‘NdsRvw’ is used which requires a third step to understand what that means. Only when the structure is understood can the value and meaning the system designer was hoping to capture be deciphered.

In cases where what value should be contained in the structure isn’t known, a NULL value is inserted as a placeholder. That’s right, a value literally saying nothing. Traditional systems are built as structure first, content second. First the schema, the structure definition, gets built. Then it is populated with content. The meaning of the content may or may not survive the contortions required to stuff it into the structure, but it gets stuffed in anyway in the hope it can deciphered later when extracted for a given purpose. Given situations where there is a paucity of data, there is a special name for a structure that largely says nothing – sparse tables. These are tables known to likely contain only a very few of the possible values, but the structure still has to be defined before the rare case values actually show up. Sparse tables are like requiring you to have a shoe box for every type of shoe you could possibly ever own even though you actually only own a few pair.

Structure-first thinking is so embedded in our DNA that we find it inconceivable that we can manage data without first building the structure. As a result, flag structures are often put in to drive system functionality. Logic then gets built to execute the flag dance and get executed every time interaction with the data occurs. The logic says something like this:
IF this flag DOESN’T say nothing
THEN do this next thing
OTHERWISE skip that next step
OR do something else completely.
Sadly, structure-first thinking requires this type of logic to be in place. The NULL placeholders are a default value to keep the empty space accounted for, and there has to be logic to deal with them.

Semantics, on the other hand, is meaning-first thinking. Since there is no meaning in NULL, there is no concept of storing NULL. Semantics captures meaning by making assertions. In semantics we write code that says “DO this with this data set.” No IF-THEN logic, just DO this and get on with it. Here is an example of how semantics maintains the fidelity of our information without having vacuous assertions.

The system can contain an assertion that the Jefferson contract is categorized as ‘Needs Review’ which puts it into the set of all contracts needing review. It is a subset of all the contracts. The rest of the contracts are in the set of all contracts NOT needing review. These are separate and distinct sets which are collectively the set of all contracts, a third set. System functionality can be driven by simply selecting the set requiring action, the “Needs Review” set, the set that excludes those that need review, or the set of all contracts. Because the contracts requiring review are in a different set, a sub-set, and it was done with a single step, the processing logic is cut in half. Where else can you get a 50% discount and do less work to get it?

I love a good flag, but I don’t think they would have caught on if we needed to ask the flag-bearer what the label on the flagpole said to understand what it stood for.

Blog post by Mark Ouska 

For more reading on the topic, check out this post by Dave McComb.

Semantic Ontology: The Basics

What is Semantics?

Semantics is the study of meaning. By creating a common understanding of the meaning of things, semantics helps us better understandsemantic arts each other. Common meaning helps people understand each other despite different experiences or points of view. Common meaning in semantic technology helps computer systems more accurately interpret what people mean. Common meaning enables disparate IT systems – data sources and applications – to interface more efficiently and productively.

What is an Ontology?

An ontology defines all of the elements involved in a business ecosystem and organizes them by their relationship to each other. The benefits of building an ontology are:

  • Everyone agrees on a common set of terms used to describe things
  • Different systems – databases and applications – can communicate with each other without having to directly connect to each other.

Enterprise Ontology

An Ontology is a set of formal concept definitions.

An Enterprise Ontology is an Ontology of the key concepts that organize and structure an Organization’s information systems. Having an Enterprise Ontology provides a unifying whole that makes system integration bearable.

An Enterprise Ontology is like a data dictionary or a controlled vocabulary, however it is different in a couple of key regards. A data dictionary, or a controlled vocabulary, or even a taxonomy, relies on humans to read the definitions and place items into the right categories. An ontology is a series of rules about class (concept) membership that uses relationships to set up the inclusion criteria. This has several benefits, one of the main ones being that a system (an inference engine) can assign individuals to classes consistently and automatically.

By building the ontology in application neutral terminology it can fill the role of “common denominator” between the many existing and potential data sources you have within your enterprise. Best practice in ontology building favors building an Enterprise Ontology with the fewest concepts needed to promote interoperability, and this in turns allows it to fill the role of “least common denominator”

Building an Enterprise Ontology is the jumping off point for a number of Semantic Technology initiatives. We’ll only mention in passing here the variety of those initiatives (we invite you to poke around our web site to find out more) . We believe that Semantic Technology will change the way we implement systems in three major areas:

  • Harvest – Most of the information used to run most large organizations comes from their “applications” (their ERP or EHR or Case Management or whatever internal application). Getting new information is a matter of building screens in these applications and (usually) paying your employees to enter data, such that you can later extract it for other purposes. Semantic Technology introduces approaches to harvest data not only from internal apps, but from Social Media, unstructured data and the vast and growing sets of publicly available data waiting to be integrated.
  • Organize – Relational, and even Object Oriented, technology, impose a rigid, pre-defined structure and set of constraints on what data can be stored and how it is organized. Semantic Technology replaces this with a flexible data structure that can be changed without converting the underlying data. It is so flexible that not all the users of a data set need to share the same schema (they need to share some part of the schema, otherwise there is no basis for sharing, but they don’t need to be in lockstep, each can extend the model independently). Further the semantic approach promotes the idea that the information is at least partially “self-organizing.” Using URIs (Web based Uniform Resource Identifiers) and graph-based databases allows these systems to infer new information from existing information and then use that new information in the dynamic assembly of data structures.
  • Consume — Finally we think semantic technology is going to change the way we consume information. It is already changing the nature of work flow-oriented systems (ask us about BeInformed). It is changing data analytics. It is the third “V” in Big Data (“Variety”). Semantic Based mashups are changing the nature of presentation. Semantic based Search Engine Optimization (SEO) is changing internal and external search.

Given all that, how does one get started?

Well you can do it yourself. We’ve been working in this space for more than twenty years and have been observing clients take on a DIY approach, and while there have been some successes, in general we see people recapitulating many of the twists and turns that we have worked through over the last decade.

You can engage some of our competitors (contact us and we’d be happy to give you a list). But, let us warn you ahead of time: most of our competitors are selling products, and as such their “solutions” are going to favor the scope of the problem that their tools address. Nothing wrong with that, but you should know going in, that this is a likely bias. And, in our opinion, our competitors are just not as good at this as we are. Now it may come to pass that you need to go with one of our competitors (we are a relatively small shop and we can’t always handle all the requests we get) and if so, we wish you all the best…

If you do decide that you’d like to engage us, we’d suggest a good place to get started would be with an Enterprise Ontology. If you’d like to get an idea, for your budgeting purposes, what this might entail, click here to get in touch, and you’ll go through a process where we help you clarify a scope such that we can estimate from it. Don’t worry about being descended on by some over eager sales types, we recognize that these things have their own timetables and we will be answering questions and helping you decide what to do next. We recognize that these days “selling” is far less effective than helping clients do their own research and supporting your buying process.

That said, there are three pretty predictable next steps:

  • Ask us to outline what it would cost to build an Enterprise Ontology for your organization (you’d be surprised it is far less than the effort to build and Enterprise Data Model or equivalent)
  • gist – as a byproduct of our work with many Enterprise Ontologies over the last decade we have built and made publicly available “gist” which is an upper ontology for business systems. We use it in all our work and we have made it publicly available via a Creative Commons Share Alike license (you can use it for any purpose provided you acknowledge where you got it)
  • Training – if you’d like to learn more about the language and technology behind this (either through public courses or in house) check out of offerings in training.

How is Semantic Technology different from Artificial Intelligence?

Artificial Intelligence (AI) is a 50+ year old academic discipline that provided many technologies that are now in commercial use. Two things comprise the core of semantic technology. The first stems from AI research in knowledge representation and reasoning done in the 70s and 80s and includes ontology representation languages such as OWL and inference engines like Fact++. The second relates to data representation and querying using triple stores, RDF and SPARQL, which are largely unrelated to AI. A broad definition of semantic technology includes a variety of other technologies that emerged from AI. These include machine learning, natural language processing, intelligent agents and to a lesser extent speech recognition and planning. Areas of AI not usually associated with semantic technology include creativity, vision and robotics.

How Does Semantics Use Inference to Build Knowledge?

Semantics organizes data into well-defined categories with clearly defined relationships. Classifying information in this way enables humans and machines to read, understand and infer knowledge based on its classification. For example, if we see a red breasted bird outside our window in April, our general knowledge leads us to identify it as a robin. Once it is properly categorized, we can infer a lot more information about the robin then just its name.

We know for example that it is a bird; it flies; it sings a song; it spends its winter somewhere else and the fact that it has showed up means that good weather is on its way.

We know this other information because the robin has been correctly identified within the schematic of our general knowledge about birds, a higher classification; seasons, a related classification, etc.

This is a simple example of by correctly classifying information into a predefined structure we can infer new knowledge. In a semantic model, once the relationships are set up, a computer can classify data appropriately, analyze it based on the predetermined relationships and then infer new knowledge based on this analysis.

What is Semantic Agreement?

The primary challenge in building an ontology is getting people to agree about what they really mean when they describe the concepts that define their business. Gaining semantic agreement is the process of helping people understand exactly what they mean when they express themselves.

Semantic technologists accomplish this because they define terms and relationships independent from the context of how they are applied or the IT systems that store the information, so they can build pure and consistent definitions across disciplines.

Why is Semantic Agreement Important?

Semantic agreement is important because it is enables disparate computer systems to communicate directly with each other. If one application defines a customer as someone who has placed an order and another application defines the customer as someone who might place an order, then the two applications cannot pass information back and forth because they are talking about two different people. In a traditional IT approach, the only way the two applications will be able to pass information back and forth is through a systems integration patch. Building these patches costs time and money because it requires the owners of the two systems need to negotiate a common meaning and write incremental code to ensure that the information is passed back and forth correctly. In a semantic enabled IT environment, all the concepts that mean the same thing are defined by a common meaning, so the different applications are able to communicate with each other without having to write systems integration code.

What is the Difference Between a Taxonomy and Ontology?

A taxonomy is a set of definitions that are organized by a hierarchy that starts at the most general description of something and gets more defined and specific as you go down the hierarchy of terms. For example, a red-tailed hawk could be represented in a common language taxonomy as follows:

  • Bird
    • Raptors
    • Hawks
      • Red Tailed Hawk

An ontology describes a concept both by its position in a hierarchy of common factors like the above description of the red-tailed hawk but also by its relationships to other concepts. For example, the red-tailed hawk would also be associated with the concept of predators or animals that live in trees.

The richness of the relationships described in an ontology is what makes it a powerful tool for modeling complex business ecosystems.

What is the Difference Between a Logical Data Model and Ontology?

The purpose of an ontology is to model the business. It is independent from the computer systems, e.g. legacy or future applications and databases. Its purpose is to use formal logic and common terms to describe the business, in a way that both humans and machines can understand. Ontologies use OWL axioms to describe classes and properties that are shared across multiple lines of business so concepts can be defined by their relationships, making them extensible to increasing levels of detail as required. Good ontologies are ‘fractal’ in nature, meaning that the common abstractions create an organizing structure that easily expands to accommodate the complex information management requirements of the business. The purpose of a logical model is to describe the structure of the data required for a particular application or service. Typically, a logical model shows all the entities, relationships and attributes required for a proposed application. It only includes data relevant to the particular application in question. Ideally logical models are derived from the ontology which ensures consistent meaning and naming across future information systems.

How can an Ontology Link Computer Systems Together?

Since an ontology is separate from any IT structure, it is not limited by the constraints required by specific software or hardware. The ontology exists as a common reference point for any IT system to access. Thanks to this independence, it can serve as a common ground for different:

  • database structures, such as relational and hierarchical,
  • applications, such as an SAP ERP system and a cloud-hosted e-market,
  • devices, such as an iPad or cell phone.

The benefit of the semantic approach is that you can link the legacy IT systems that are the backbone of most business to exciting new IT solutions, like cloud computing and mobile delivery.

What are 5 Business Benefits of Semantic Technology Solutions?

Semantic technology helps us:

  1. Find more relevant and useful information
    • Because it enables us to search information from disparate sources (federated search) and automatically refine our searches (faceted search).
  2. Better understand what is happening
    • Because it enables us to use the relationships between concepts to predict and interpret change.
  3. Build more transparent systems and communications
    • Because it is based on common meanings and mutual understanding of the key concepts and relationships that govern our business ecosystems.
  4. Increase our effectiveness, efficiency and strategic advantage
    • Because it enables us to make changes to our information systems more quickly and easily.
  5. Become more perceptive, intelligent and collaborative
    • Because it enables us to ask questions we couldn’t ask before.

How Can Semantic Technology Enable Dynamic Workflow?

Semantic-driven dynamic workflow systems are a new way to organize, document and support knowledge management. They include two key things:

  1. A consistent, comprehensive and rigorous definition of an ecosystem that defines all its elements and the relationships between elements. It is like a map.
  2. A set of tools that use this model to:
    • Gather and deliver ad hoc, relevant data.
    • Generate a list of actions – tasks, decisions, communications, etc. – based on the current situation.
    • Facilitate and document interactions in the ecosystem.

These tools work like a GPS system that uses the map to adjust its recommendations based on human interactions This new approach to workflow management enables organizations to respond faster, make better decisions and increase productivity.

Why Do Organizations Need Semantic-Driven, Dynamic Workflow Systems?

A business ecosystem is a series of interconnected systems that is constantly changing. People need flexible, accurate and timely information and tools to positively impact their ecosystems. Then they need to see how their actions impact the systems’ energy and flow. Semantic-driven, dynamic workflow systems enable users to access information from non-integrated sources, set up rules to monitor this information and initiate workflow procedures when the dynamics of the relationship between two concepts change. It also supports the definition or roles and responsibilities to ensure that this automated process is managed appropriately and securely. Organizational benefits to implementing semantic-driven, dynamic workflow systems include:

  • Improved management of complexity
  • Better access to accurate and timely information
  • Improved insight and decision making
  • Proactive management of risk and opportunity
  • Increased organizational responsiveness to change
  • Better understanding of the interlocking systems that influence the health of the business ecosystem

Blog post by Dave McComb

Click here to read a free chapter of Dave McComb’s book, “A Data-Centric Revolution”


White Paper: The Value of Using Knowledge Graphs in Some Common Use Cases

We’ve been asked to comment on the applicability of Knowledge Graphs and Semantic Technology in service of a couple of common use cases.  We will draw on our own experience with client projects as well as some examples we have come to from networking with our peers.

The two use cases are:

  • Customer 360 View
  • Compliance

We’ll organize this with a brief review of why these two use cases are difficult for traditional technologies, then a very brief summary of some of the capabilities that these new technologies bring to bear, and finally a discussion of some case studies that have successfully used graph and semantic technology to address these areas.

Why is This Hard?

In general, traditional technologies encourage complexity, and they encourage it through ad-hoc introduction of new data structures.  When you are solving an immediate problem at hand, introducing a new data structure (a new set of tables, a new json data structure, a new message, a new API, whatever) seems to be an expedient.  What is rarely noticed is the accumulated effect of many, many small decisions taken this way.  We were at a healthcare client who admitted (they were almost bragging about it) that they had patient data in 4,000 tables in their various systems.  This pretty much guarantees you have no hope of getting a complete picture of a patient’s health and circumstances. There is no human that could write a 4,000 table join and no systems that could process it even if it were able to be written.

This shows up everywhere we look.  Every enterprise application we have looked at in detail is 10-100 times more complex than it needs to be to solve the problem at hand.  Systems of systems (that is the sum total of the thousands of application systems managed by a firm) are 100- 10,000 times more complex than they need to be.  This complexity shows up for users who have to consume information (so many systems to interrogate, each arbitrarily different) and developers and integrators who fight a read guard action to keep the whole at least partially integrated.

Two other factors contribute to the problem:

  • Acquisition – acquiring new companies inevitably brings another ecosystem of applications that must be dealt with.
  • Unstructured information – a vast amount of important information is still represented in unstructured (text) or semi-structured forms (XML, Json, HTML). Up until now it has been virtually impossible to meaningfully combine this knowledge with the structured information businesses run on.

Let’s look at how these play out in the customer 360 view and compliance.

Customer 360

Eventually, most firms decide that it would be of great strategic value to provide a view of everything that is known about their customers. There are several reasons this is harder than it looks.  We summarize a few here:

  • Customer data is all over the place. Every system that places an order, or provides service, has its own, often locally persisted set of data about “customers.”
  • Customer data is multi-formatted. Email and customer support calls represent some of the richest interactions most companies have with their clients; however, these companies find data from such calls difficult to combine with the transactional data about customers.
  • Customers are identified differently in different systems. Every system that deals with customers assigns them some sort of customer ID. Some of the systems share these identifiers.  Many do not.  Eventually someone proposes a “universal identifier” so that each customer has exactly one ID.  This almost never works.  In 40 years of consulting I’ve never seen one of these projects succeed.  It is too easy to underestimate how hard it will be to change all the legacy systems that are maintaining customer data.  And as the next bullet suggests, it may not be logically possible.
  • The very concept of “customer” varies widely from system to system. In some systems the customer is an individual contact; in other, a firm; in another a role; in yet another, a household. For some it is a bank account (I know how weird that sounds but we’ve seen it).
  • Each system needs to keep different data about customers in order to achieve their specific function. Centralizing this puts a burden of gathering a great deal of data at customer on-boarding time that may not be used by anyone.

Compliance

The primary reason that compliance related systems are complex is that what you are complying with is a vast network of laws and regulations written exclusively in text and spanning a vast array of overlapping jurisdictions.  These laws and regulations are changing constantly and are always being re-interpreted through findings, audits, and court cases.

The general approach is to carve off some small scope, read up as much as you can, and build bespoke systems to support them. The first difficulty is that there are humans in the loop all throughout the process.  All documents need to be interpreted, and for that interpretation to be operationalized it generally has to be through a hand-crafted system.

A Brief Word on Knowledge Graphs and Semantic Technology

Knowledge Graphs and Graph Databases have gained a lot of mind share recently as it has become known that most of the very valuable digital native firms have a knowledge graph at their core:

  • Google – the google knowledge graph is what has made their answering capability so much better than the key word search that launched their first offering. It also powers their targeted ad placement.
  • LinkedIn, Facebook, Twitter – all are able to scale and flex because they are built on graph databases.
  • Most Large Financial Institutions – almost all major financial institutions have some form of Knowledge Graph or Graph Database initiative in the works.

Graph Databases

A graph database expresses all its information in a single, simple relationship structure: two “nodes” are connected by an “edge.”

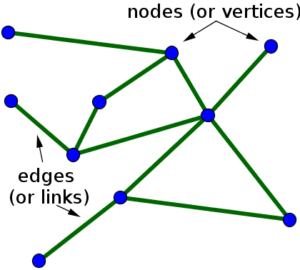
A node is some identifiable thing.  It could be a person or a place or an email or a transaction.  An “edge” is the relationship between two nodes.  It could represent where someone lives, that they sent or received an email, or that they were a party to a transaction.

A graph database does not need to have the equivalent of a relational table structure set up before any data can be stored, and you don’t need to know the whole structure of the database and all its metadata to use a graph database.  You can just add new edges and nodes to existing nodes as soon as you discover them.  The network (the graph) grows organically.

The most common use case for graph databases are analytic.  There are a whole class of analytics that make use of network properties (i.e., how closely x is connected to y, what the shortest route is from a to b).

Knowledge Graphs

Most graph databases focus on low level data: transactions, communications, and the like. If you add a knowledge layer onto this, most people refer to this as a knowledge graph.  The domain of medical knowledge (diseases, symptoms, drug/drug interaction, and even the entire human genome) has been converted to knowledge graphs to better understand and explore the interconnected nature of health and disease.

Often the knowledge in a knowledge graph has been harvested from documents and converted to the graph structure.  When you combine a knowledge graph with specific data in a graph database the combination is very powerful.

Semantic Technology

Semantic Technology is the open standards approach to knowledge graphs and graph databases.  (Google, Facebook, LinkedIn and Twitter all started with open source approaches, but have built their own proprietary versions of these technologies.)  For most firms we recommend going with open standards.  There are many open source and vendor supported products at every level of the stack, and a great deal of accumulated knowledge as to how to solve problems with these technologies.

Semantic technologies implement an alphabet soup of standards, including: RDF, RDFS, OWL, SPARQL, SHACL, R2RML, JSON-LD, and PROV-O.  If you’re unfamiliar with these it sounds like a bunch of techno-babble. The rap against semantic technology has been that it is complicated.  It is, especially if you have to embrace and understand it all at once.  But we have been using this technology for almost 20 years and have figured out how to help people adapt by using carefully curated subsets of each of the standards and leading through example to drastically reduce the learning curve.

While there is still some residual complexity, we think it is well worth the investment in time.  The semantic technologies stack has solved a large number of problems that graph databases and knowledge graphs have to solve on their own, on a piecemeal basis.  Some of these capabilities are:

  • Schema – graph databases and even knowledge graphs have no standard schema, and if you wish to introduce one you have to implement the capability yourself. The semantic technologies have a very rich schema language that allows you to define classes based on what they mean in the real world.  We have found that disciplined use of this formal schema language creates enterprise models that are understandable, simple, and yet cover all the requisite detail.
  • Global Identifiers – semantic technology uses URIs (the Unicode version of which is called an IRI) to identify all nodes and arcs. A URI looks a lot like a URL, and best practice is to build them based on a domain name you own.  It is these global identifiers that allow the graphs to “self-assemble” (there is no writing of joins in semantic technology, the data is already joined by the system).
  • Identity Management – semantic technology has several approaches that make living with the fact that you have assigned multiple identifiers to the same person or product or place. One of the main ones is called “sameAs” and allows the system to know that ‘n’ different URIs (which were produced from data in ‘n’ different systems, with ‘n’ different local IDs) all represent the same real-world item, and all information attached to any of those URIs is available to all consumers of the data (subject to security, of course).
  • Resource Resolution – some systems have globally unique identifiers (you’ve seen those 48-character strings of numbers and letters that come with software licenses, and the like), but these are not very useful, unless you have a special means for finding out what any of them are or mean. Because semantic technology best practice says to base your URIs on a domain name that you own, you have the option for providing a means for people to find out what the URI “means” and what it is connected to.
  • Inference – with semantic technology you do not have to express everything explicitly as you do in traditional systems. There is a great deal of information that can be inferred based on the formal definitions in the knowledge graph as part of the semantic schema and combined with the detailed data assertions.
  • Constraint Management – most graph databases and knowledge graphs were not built for online interactive end user update access. Because of their flexibility it is hard to enforce integrity management. Semantic technology has a model driven constraint manager that can ensure the integrity of a database is maintained.
  • Provenance – one key use case in semantic technology is combining data from many different sources. This creates a new requirement when looking at data that has come from many sources you often need to know: Where did this particular bit of data come from?  Semantic Technologies have solved this in a general way that can go down to individual data assertions.
  • Relational and Big Data Integration – you won’t be storing all of your data in a graph database (semantic, or otherwise). Often you will want to combine data in your graph with data in your existing systems.  Semantic technology has provided standards, and there are vendors that have implemented these standards, such that you can write a query that combines information in the graph with that in a relational database or a big data store.

It is hard to cover a topic as broad as this in a page, but hopefully this establishes some of what the approach provides.

Applying Graph Technology

So how do these technologies deliver capability to some more common business problems?

Customer 360

We worked with a bank that was migrating to the cloud.  As part of the migration they wanted to unify their view of their customers.  They brought together a task force from all the divisions to create a single definition of a customer.  This was essentially an impossible task.  For some divisions (Investment Banking) a customer was a company, for others (Credit Card processing) it was usually a person.  Not only were there differences in type, all the data that they wanted and were required to have in these different contexts was different.  Further one group (corporate) espoused a very broad definition of customer that included anyone that they could potentially contact.  Needless to say, the “Know Your Customer” group couldn’t abide this definition as every new customer obligates them to perform a prescribed set of activities.

What we have discovered time and again is that if you start with a term (say, “Customer”) and try to define it, you will be deeply disappointed.  On the other hand, if you start with formal definitions (one of which for “Customer” might be, “a Person who is an owner or beneficiary on a financial account” (and of course financial account has to be formally defined)), it is not hard to get agreement on what the concept means and what the set of people in this case would be.  From there it is not hard to get to an agreed name for each concept.

In this case we ended up creating a set of formal, semantic definitions for all the customer related concepts.  At first blush it might sound like we had just capitulated to letting everyone have their own definition of what a “Customer” was.  While there are multiple definitions of “Customer” in the model, they are completely integrated in a way that any individual could be automatically categorized and simultaneously in multiple definitions of “Customer” (which is usually the case).

The picture shown below, which mercifully omits a lot of the implementation detail, captures the essence of the idea. Each oval represents a definition of “Customer.”

Knowledge graphs

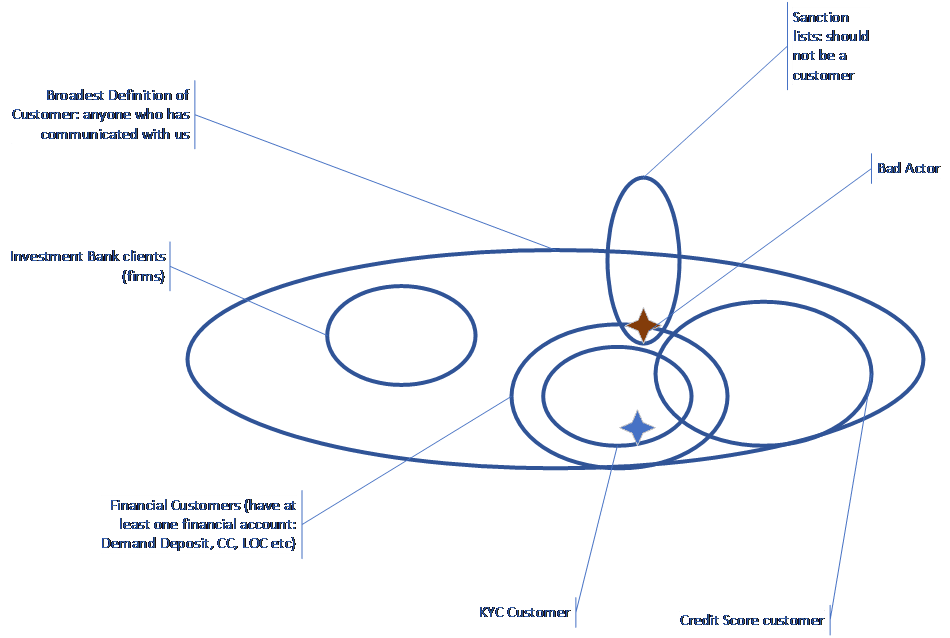
In the lower right is the set of people who have signed up for a free credit rating service.  These are people who have an “Account’ (the credit reporting account), but it is an account without financial obligation (there is no balance, you cannot draw against it, etc.).  The Know Your Customer (KYC) requirements only kick in for people with Financial Accounts.  The overlap suggests some people have financial accounts and non-financial accounts.  The blue star represents a financial customer that also falls under the guidelines of KYC.  Finally, the tall oval at the top represents the set of people and organizations that are not to be customers, the so-called “Sanctions lists.”  You might think that these two ovals should not overlap, but with the sanctions continually changing and our knowledge of customer relations constantly changing, it is quite possible that we discover after the fact that a current customer is on the sanctions list.  We’ve represented this as a brown star that is simultaneously a financial customer and someone who should not be a customer.

We think this approach uniquely deals with the complexity inherent in large companies’ relationships with their customers.

In another engagement we used a similar approach to find customers who were also vendors, which is often of interest, and typically hard to detect consistently.

Compliance

Compliance also is a natural for solving with Knowledge Graphs.

Next Angles

Mphasis’ project “Next Angles” converts regulatory text into triples conforming to an ontology, which they can then use to evaluate particular situations (we’ve worked with them in the past on a semantic project).  In this white paper they outline how it has been used to streamline the process of detecting money laundering: http://ceur-ws.org/Vol-1963/paper498.pdf.

Legal and Regulatory Information Provider

Another similar project that we worked on was with a major provider of legal and regulatory information.  The firm ingests several million documents a day, mostly court proceedings but also all changes to laws and regulation.  For many years these documents were tagged by a combination of scripts and off shore human taggers.  Gradually the relevance and accuracy of their tagging began to fall behind that of their rivals.

They employed us to help them develop an ontology and knowledge graph; they employed the firm netOWL to perform the computational linguistics to extract data from documents and conform it to the ontology.  We have heard from third parties that the relevance of their concept-based search is now considerably ahead of their competitors.

They recently contacted us as they are beginning work on a next generation system, one that takes this base question to the next level: Is it possible to infer new information in search by leveraging the knowledge graph they have plus a deeper modeling of meaning?

Investment Bank

We are working in the Legal and Compliance Division for a major investment bank.  Our initial remit was to help with compliance to records retention laws. There is complexity at both ends of this domain.  On one end there are hundreds of jurisdictions promulgating and changing laws and regulations continually.  On the other end are the billions of documents and databases that must be classified consistently before they can be managed properly.

We built a knowledge graphs that captured all the contextual information surrounding a document or repository.  This included who authored it, who put it there, what department were they in, what cost code they charged, etc., etc.  Each bit of this contextual data had textual data available.  We were able to add some simple natural language processing that allowed them to accurately classify about 25% of the data under management.  While 25% is hardly a complete solution, this compares to ½ of 1% that had been classified correctly up to that point.  Starting from this they have launched a project with more sophisticated NLP and Machine Learning to create an end user “classification wizard” that can be used by all repository managers.

We have moved on to other related compliance issues, which includes managing legal holds, operation risk, and a more comprehensive approach to all compliance.

Summary: Knowledge Graphs & Semantic Technology

Knowledge Graphs and Semantic Technology are the preferred approach to complex business problems, especially those that require the deep integration of information that was previously hard to align, such as customer-related and compliance-related data.

Click here to download the white paper.

What Size is Your Meaning?

It’s an odd question, yet determining size is the tacit assumption behind traditional data management efforts. That assumption existssemantic technology because, traditionally, there has always been a structure built in rows and columns to store information. This is based on physical thinking.

Size matters when building physical things. Your bookshelf needs to be tall, wide and deep enough for your books. If the garage is too small, you won’t be able to fit your truck.

Rows and columns have been around since the early days of data processing, but Dan Bricklin brought this paradigm to the masses when he invented VisiCalc. His digital structure allowed us to perform operations on entire rows or columns of information. This is a very powerful concept. It allows a great deal of analysis to be done and great insight to be delivered. It is, however, still rooted in the same constraint as the book shelf or garage; how tall, wide, and deep must the structure be?

Semantic technology flips this constraint on its head by shifting away from structure and focusing on meaning.

Meaning, unlike books, has no physical size or dimension.

Meaning will have volume when we commit it to a storage system, but it remains shapeless just like water. There is no concept of having to organize water in a particular order or structure it within a vessel. It simply fills the available space.

At home, we use water in its raw form. It’s delivered to us through a system of pipes as a liquid, which is then managed according to its default molecular properties. When thirsty, we pour it into a glass. If we want a cold beverage, we freeze it in an ice cube tray. Heated into steam, it gives us the ability to make cappuccino.

We don’t have different storage or pipes to manage delivery in each of these forms; it is stored in reservoirs and towers and is delivered through a system of pipes as a liquid. Only after delivery do we begin to change it for our consumption patterns. Storage and consumption are disambiguated from one another.

Semantic technology treats meaning like water. Data is stored in a knowledge graph, in the form of triples, where it remains fluid. Only when we extract meaning do we change it from triples into a form to serve our consumption patterns. Semantics effectively disambiguates the storage and consumption concerns, freeing the data to be applied in many ways previously unavailable.

Meaning can still be extracted in rows and columns where the power of aggregate functions can be applied. It can also be extracted as a graph whose shape can be studied, manipulated, and applied to different kinds of complex problem solving. This is possible because semantic technology works at the molecular level preventing structure from being imposed prematurely.

Knowledge graphs are made up of globally unique information units (atoms) which are then combined into triples (molecules). Unlike water’s two elements, ontologies establish a large collection of elements from which the required set of triples (molecules) are created. Triples are comprised of a Subject, Predicate, and Object. Each triple is an assertion of some fact about the Subject. Triples in the knowledge graph are all independently floating around in a database affectionately known as a “bag of triples” because of its fluid nature.

Semantic technology stores meaning in a knowledge graph using Description Logics to formalize what our minds conceptualize. Water can be stored in many containers and still come out as water just like a knowledge graph can be distributed across multiple databases and still contain the same meaning. Data storage and data consumption are separate concerns that should be disambiguated from one another.

Semantic technology is here, robust and mature, and fully ready to take on enterprise data management. Rows and columns have taken us a long way, but they are getting a bit soggy.

It’s time to stop imposing artificial structure when storing our data and instead focus on meaning. Let’s make semantic technology our default approach to handling the data tsunami.

Blog post by Mark Ouska

Data-Centric vs. Application-Centric

Data-Centric vs. Software Wasteland

Dave McComb’s new book “Software Wasteland: How the Application-Centric Mindset is Hobbling our Enterprises” has just been released.

In it, I make this case that the opposite of Data-Centric is Application Centric, and our preoccupation with Application-Centric approaches over the last several decades has caused the cost and complexity of our information systems to be at least 10 times what they should be and in most cases we’ve examined, 100 times what they should be.

This article is a summary about how diametrically opposed these two world views are, and how the application-centric mind set is draining our corporate coffers.

An information system is essentially data and behavior.

On the surface, you wouldn’t think it would make much difference with which one you started with if you need both and they feed off each other.  But it turns out it does make a difference.  A very substantial difference.

Screen Shot 2018-03-04 at 10.20.54 PM

What does it do?

The application-centric approach starts with “what does this system need to do?” Often this is framed in terms of business process and/or work flow.  In the days before automation, information systems were work flow systems.  Humans executed tasks or procedures.  Most tasks had prerequisite data input and generated data output.  The classic “input / process / output” mantra described how work was organized.

Information in the pre-computer era was centered around “forms.”  Forms were a way to gather some prerequisite data, which could then be processed.  Sometimes the processing was calculation.  The form might be hours spent and pay rate, and the calculation might be determining gross pay.

These forms also often were filed, and the process might be to retrieve the corresponding form, in the corresponding (paper) file folder and augment it as needed.

While this sounds like ancient history, it persists.  If you’ve been the doctor recently, you might have noticed that despite decades of “Electronic Medical Records,” the intake is weirdly like it always has been: paper form based.

This idea that information systems are the automation of manual work flow tasks continues.  In the Financial Service industry, it is called RPA (Robotic Process Automation) despite the fact that there are no robots.  What is being automated are the myriad of tasks that have evolved to keep a Financial Services firm going.

When we automate a task in this way, we buy into a couple of interesting ideas, without necessarily noticing that we have done so.  The first is that automating the task is the main thing.  The second is that the task defines how it would like to see the input and how it will organize the output.  This is why there are so many forms in companies and especially in the government.

The process automation essentially exports the problem of getting the input assembled and organized into the form the process wants.  In far too many cases this falls on the user of the system to input the data, yet again, despite the fact that you know you have told this firm this information dozens of times before.

In the cases where the automation does not rely on a human to recreate the input, something almost as bad is occurring: developers are doing “systems integration” to get the data from wherever it is to the input structures and then aligning the names, codes and categories to satisfy the input requirements.

Most large firms have thousands of these processes.  They have implemented thousands of application systems, each of which automates anywhere between a handful and dozens of these processes.  The “modern” equivalent of the form is the document data structure.  A document data structure is not a document in the same way that Microsoft Word creates a document. Instead, a document data structure is a particular way to organize a semi-structured data structure.  The most popular now is json (javascript object notation).

A typical json document looks like:

{‘Patient’: {‘id’: ‘12345’, ‘meds’: [ ‘2345’, ‘3344’, ‘9876’] } }

Json relies on two primary structures: lists and dictionaries.  Lists are shown inside square brackets (the list following the work ‘meds’ in the above example).  Dictionaries are key / value pairs and are inside the curly brackets.  In the above ‘id’ is a key and ‘12345’ is the value, ‘meds’ is a key and the list is the value, and ‘Patient’ is a key and the complex structure (a dictionary that contains a both simple values and lists) is the value.  These can be arbitrarily nested.

Squint very closely and you will see the document data structure is our current embodiment of the form.

The important parallels are:

  • The process created the data structure to be convenient to what the process needed to do.
  • There is no mechanism here for coordinating or normalizing these keys and values.

Process-centric is very focused on what something does.  It is all about function.

Click here to continue reading on TDAN.com

Data-Centric’s Role in the Reduction of Complexity

Complexity Drives Cost in Information Systems

A system with twice the number of lines of code will typically cost more than twice as much to build and maintain.

There is no economy of scale in enterprise applications.  There is dis economy of scale.   In manufacturing, every doubling of output results in predictable reduction in the cost per unit.  This is often called a learning curve or an experience curve.

Just the opposite happens with enterprise applications.  Every doubling of code size means that additional code is added at ever lower productivity.  This is because of complex dependency.  When you manufacture widgets, each widget has no relationship to or dependency on, any of the other widgets.  With code, it is just the opposite.  Each line must fit in with all those that preceded it.  We can reduce the dependency, with discipline, but we cannot eliminate it.

If you are interested in reducing the cost of building, maintaining, and integrating systems, you need to tackle the complexity issue head on.

The first stopping point on this journey is recognizing the role that schema has in the proliferation of code.  Study software estimating methodologies, such as function point analysis, and you will quickly see the central role that schema size has on code bloat.  Function point analysis estimates effort based on inputs such as the number of fields on a form, the elements in a transaction, or the columns in a report.  Each of these is directly driven by the size of the schema.  If you add attributes to your schema they must show up in forms, transactions, and reports, otherwise, what was the point?

I recently did a bit of forensics on a popular and well known high quality application: Quick Books, which I think is representative.  The Quick Books code base is 10 million lines of code.  The schema consists of 150 tables and 7500 attributes (or 7650 schema concepts in total).  That means that each schema concept, on average, contributed another 1300 lines of code to the solutions.  Given that most studies have placed the cost to build and deploy software at between $10 and $100 per line of code (it is an admittedly large range but you have to start somewhere) that means that each attribute added to the schema is committing the enterprise to somewhere between $13K and $130K of expense just to deploy, and probably an equal amount over the life of the product for maintenance.

I’m hoping this would give data modelers a bit of pause.  It is so easy to add another column, let alone another table to a design; it is sobering to consider the economic impact.

But that’s not what this article is about.  This article is about the insidious multiplier effect that not following the data centric approach is having on enterprises these days.

Let us summarize what is happening in enterprise applications:

  • The size of each application’s schema is driving the cost of building, implementing, and maintaining it (even if the application is purchased).
  • The number of applications drives the cost of systems integration (which is now 30-60% of all IT costs).
  • The overlap, without alignment, is the main driver of integration costs (if the fields are identical from application to application, integration is easy; if the applications have no overlap, integration is unnecessary).

We now know that most applications can be reduced in complexity by a factor of 10-100.  That is pretty good.  But the systems of systems potential is even greater.  We now know that even very complex enterprises have a core model that has just a few hundred concepts.  Most of the rest of the distinctions can be made taxonomically and not involve programming changes.

When each sub domain directly extends the core model, instead of the complexity being multiplicative, it is only incrementally additive.

We worked with a manufacturing company whose core product management system had 700 tables and 7000 attributes (7700 concepts).  Our replacement system had 46 classes and 36 attributes (82 concepts) – almost a 100-fold reduction in complexity.  They acquired another company that had their own systems, completely and arbitrarily different, smaller and simpler at 60 tables and 1000 attributes or 1060 concepts total.  To accommodate the differences in the acquired company we had to add 2 concepts to the core model, or about 3%.

Normally, trying to integrate 7700 concepts with 1060 concepts would require a very complex systems integration project.  But once the problem is reduced to its essence, we realize that there is a 3% increment, which is easily managed.

What does this have to do with data centricity?

Until you embrace data centricity, you think that the 7700 concepts and the 1060 concepts are valid and necessary.  You’d be willing to spend considerable money to integrate them (it is worth mentioning that in this case the client we were working with had acquired the other company ten years ago and had not integrated their systems, mostly due to the “complexity” of doing so).

Once you embrace data centricity, you begin to see the incredible opportunities.

You don’t need data centricity to fix one application.  You merely need elegance.  That is a discipline that helps guide you to the simplest design that solves the problem.  You may have thought you were doing that already.  What is interesting is that real creativity comes with constraints.  And when you constrain your design choice to be in alignment with a firms’ “core model,” it is surprising how rapidly the complexity drops.  More importantly for the long-term economics, the divergence for the overlapped bits drops even faster.

When you step back and look at the economics though, there is a bigger story:

The total cost of enterprise applications is roughly proportional to:

mccomb01

These items are multiplicative (except for the last which is a divisor).   This means if you drop any one of them in half the overall result drops in half.  If you drop two of them in half the result drops by a factor of four, and if you drop all of them in half the result is an eight-fold reduction in cost.

Dropping any of these in half is not that hard.  If you drop them all by a factor of ten (very do-able) the result is a 1000 fold reduction in cost.  Sounds too incredible to believe, but let’s take a closer look at what it would take to reduce each in half or by a factor of ten.

Click here to read more on TDAN.com

The Core Model at the Heart of Your Architecture

We have taken the position that a core model is an essential part of your data-centric architecture. In this article, we will review what a core model is, how to go about building one, and how to apply it both to analytics as well as new application development.

What is a Core Model?

A core model is an elegant, high fidelity, computable, conceptual, and physical data model for your enterprise.

Let’s break that down a bit.

Elegant

By elegant we mean appropriately simple, but not so simple as to impair usefulness. All enterprise applications have data models. Many of them are documented and up to date. Data models come with packaged software, and often these models are either intentionally or unintentionally hidden from the data consumer. Even hidden, their presence is felt through the myriad of screens and reports they create. These models are the antithesis of elegant. We routinely see data models meant to solve simple problems with thousands of tables and tens of thousands of columns. Most large enterprises have hundreds to thousands of these data models, and are therefore attempting to manage their datascape with over a million bits of metadata.

No one can understand or apply one million distinctions. There are limits to our cognitive functioning. Most of us have vocabularies in the range of 40,000-60,000, which should suggest the upper limit to a domain that people are willing to spend years to master.

Our experience tells us that at the heart of most large enterprises lays a core model that consists of fewer than 500 concepts, qualified by a few thousand taxonomic modifiers. When we use the term “concept” we mean a class (e.g., set, entity, table, etc.) or property (e.g., attribute, column, element, etc.). An elegant core model is typically 10 times simpler than the application it’s modeling, 100 times simpler than a sub-domain of an enterprise, and at least 1000 times simpler than the datascape of a firm.

Click here to continue reading on TDAN.com

The Data-Centric Revolution: Gaining Traction

There is a movement afoot. I’m seeing it all around me. Let me outline some of the early outposts.

Data-Centric Manifesto

We put out the data-centric manifesto on datacentricmanifesto.org over two years ago now. I continue to be impressed with the depth ofData-centric manifesto thought that the signers have put into their comments. When you read the signatory page (and I encourage you to do so now) I think you’ll be struck. A few just randomly selected give you the flavor:

This is the single most critical change that enterprise architects can advocate – it will dwarf the level of transformation seen from the creation of the Internet. – Susan Bright, Johnson & Johnson

Back in “the day” when I started my career we weren’t called IT, we were called Data Processing. The harsh reality is that the application isn’t the asset and never has been. What good is the application that your organization just spent north of 300K to license without the data?   Time to get real, time to get back to basics. Time for a reboot! –  Kevin Chandos

This seems a mundane item to most leaders, but if they knew its significance, they would ask why we are already not using a data-centric approach. I would perhaps even broaden the name to a knowledge-centric approach and leverage the modern knowledge management and representation technologies that we have and are currently emerging. But the principles stand either way. – David Chasteen, Enterprise Ecologist

Because I’ve encountered the decades of inertia and want to be an instrument of change and evolution. – Vince Marinelli, Medidata Solutions Worldwide

And I love this one for it’s simple frustration:

In my life I try to fight with silos – Enn Õunapuu, Tallinn University of Technology

Click here to continue reading on TDAN.com

The Data-Centric Revolution: Integration Debt

Integration Debt is a Form of Technical Debt

As with so many things, we owe the coining of the metaphor “Technical Debt” to Ward Cunningham and the agile community. It is thetechnical debt confluence of several interesting conclusions the community has come to. The first was that being agile means being able to make a simple change to a system in a limited amount of time, and being able to test it easily. That sounds like a goal anyone could get behind, and yet, this is nearly impossible in a legacy environment. Agile proponents know that any well-intentioned agile system is only six months’ worth of entropy away from devolving into that same sad state where small changes take big effort.

One of the tenants of agile is that patterns of code architecture exist that are conducive to making changes. While these patterns are known in general (there is a whole pattern languages movement to keep refining the knowledge and use of these patterns), how they will play out on any given project is emergent. Once you have a starting structure for a system, a given change often perturbs that structure. Usually not a lot. But changes add up, and over time, can greatly impede progress.

One school of thought is to be continually refactoring your code, such that, at all times, it is in its optimal structure to receive new changes. The more pragmatic approach favored by many is that for any given sprint or set of sprints, it is preferable to just accept the fact that the changes are making things architecturally worse; as a result, you set aside a specific sprint every 2-5 sprints to address the accumulated “technical debt” that these un-refactored changes have added to the system. Like financial debt, technical debt accrues compounding interest, and if you let it grow, it gets worse—eventually, exponentially worse, as debt accrues upon debt.

Integration Debt

I’d like to coin a new term: “integration debt.” In some ways it is a type of technical debt, but as we will see here, it is broader, more pervasive, and probably more costly.

Integration debt occurs when we take on a new project that, by its existence, is likely to lead someone at some later point to incur additional work to integrate it with the rest of the enterprise. While technical debt tends to occur within a project or application, integration debt takes place across projects or applications. While technical debt creeps in one change at a time, integration debt tends to come in large leaps.

Here’s how it works: let’s say you’ve been tasked with creating a system to track the effectiveness of direct mail campaigns. It’s pretty simple – you implement these campaigns as some form of project and their results as some form of outcomes. As the system becomes more successful, you add in more information on the total cost of the campaign, perhaps more granular success criteria. Maybe you want to know which prospects and clients were touched by each campaign.

Gradually, it dawns that in order to get this additional information (and especially in order to get it without incurring more research time and re-entry of data), it will require integration with other systems within the firm: the accounting system to get the true costs, the customer service systems to get customer contact information, the marketing systems to get the overlapping target groups, etc. At this point, you recognize that the firm is going to consume a great deal of resources to get a complete data picture. Yet, this could have been known and dealt with at project launch time. It even could have been prevented.

Click here to read more on TDAN.com

Whitepaper: Avoiding Property Proliferation

Domain and range for ontological properties are not about data integrity, but logical necessity. Misusing them leads to an inelegant (and unnecessary) proliferation of properties.

Logical Necessity Meets Elegance

Screwdrivers generally have only a small set of head configurations (flat, Phillips, hex) because the intention is to make accessingproperties contents or securing parts easy (or at least uniform). Now, imagine how frustrating it would be if every screw and bolt in your house or car required a unique screwdriver head. They might be grouped together (for example, a bunch of different sized hex heads), but each one was slightly different. Any maintenance task would take much longer and the amount of time spent just organizing the screwdrivers would be inordinate. Yet that is precisely the approach that most OWL modelers take when they over-specify their ontology’s properties.
On our blog, we once briefly discussed the concept of elegance in ontologies. A key criterion was, “An ontology is elegant if it has the fewest possible concepts to cover the required scope with minimal redundancy and complexity.” Let’s take a deeper look at object properties in that light. First, a quick review of some of the basics.

  1. An ontology describes some subject matter in terms of the meaning of the concepts and relationships within that ontology’s domain.
  2. Object properties are responsible for describing the relationships between things.
  3. In the RDFS and OWL modeling languages, a developer can declare a property’s domain and/or its range (the class to which the Subject and/or Object, respectively, must belong). Domain and range for ontological properties are not about data integrity, but logical necessity. Misusing them leads to an inelegant (and unnecessary) proliferation of properties. Avoiding Property Proliferation 2

Break the Habit

In our many years’ experience teaching our classes on designing and building ontologies, we find that most new ontology modelers have a background in relational databases or Object-Oriented modelling/development. Their prior experience habitually leads them to strongly tie properties to classes via specific domains and ranges. Usually, this pattern comes from a desire to curate the triplestore’s data by controlling what is getting into it. But specifying a property’s domain and range will not (necessarily) do that.
For example, let’s take the following assertions:

  • The domain of the property :hasManager is class :Organization.
  • The individual entity :_Jane is of type class :Employee.
  • :_Jane :hasManager :_George.

Many newcomers to semantic technology (especially those with a SQL background) expect that the ontology will prevent the third statement from being entered into the triplestore because :_Jane is not declared to be of the correct class. But that’s not what happens in OWL. The domain says that :_Jane must be an :Organization, which presumably is not the intended meaning. Because of OWL’s Open World paradigm, the only real constraints are those that prevent us from making statements that are logically inconsistent. Since in our example we have not declared the :Organization and :Employee classes to be disjoint, there is no logical reason that :_Jane cannot belong to both of those classes. A reasoning engine will simply infer that :_Jane is also a member of the :Organization class. No errors will be raised; the assertion will not be rejected. (That said, we almost certainly do want to declare those
classes to be disjoint.)

Read More and Download the White-paper

White Paper by Dan Carey