What Size is Your Meaning?

It’s an odd question, yet determining size is the tacit assumption behind traditional data management efforts. That assumption existssemantic technology because, traditionally, there has always been a structure built in rows and columns to store information. This is based on physical thinking.

Size matters when building physical things. Your bookshelf needs to be tall, wide and deep enough for your books. If the garage is too small, you won’t be able to fit your truck.

Rows and columns have been around since the early days of data processing, but Dan Bricklin brought this paradigm to the masses when he invented VisiCalc. His digital structure allowed us to perform operations on entire rows or columns of information. This is a very powerful concept. It allows a great deal of analysis to be done and great insight to be delivered. It is, however, still rooted in the same constraint as the book shelf or garage; how tall, wide, and deep must the structure be?

Semantic technology flips this constraint on its head by shifting away from structure and focusing on meaning.

Meaning, unlike books, has no physical size or dimension.

Meaning will have volume when we commit it to a storage system, but it remains shapeless just like water. There is no concept of having to organize water in a particular order or structure it within a vessel. It simply fills the available space.

At home, we use water in its raw form. It’s delivered to us through a system of pipes as a liquid, which is then managed according to its default molecular properties. When thirsty, we pour it into a glass. If we want a cold beverage, we freeze it in an ice cube tray. Heated into steam, it gives us the ability to make cappuccino.

We don’t have different storage or pipes to manage delivery in each of these forms; it is stored in reservoirs and towers and is delivered through a system of pipes as a liquid. Only after delivery do we begin to change it for our consumption patterns. Storage and consumption are disambiguated from one another.

Semantic technology treats meaning like water. Data is stored in a knowledge graph, in the form of triples, where it remains fluid. Only when we extract meaning do we change it from triples into a form to serve our consumption patterns. Semantics effectively disambiguates the storage and consumption concerns, freeing the data to be applied in many ways previously unavailable.

Meaning can still be extracted in rows and columns where the power of aggregate functions can be applied. It can also be extracted as a graph whose shape can be studied, manipulated, and applied to different kinds of complex problem solving. This is possible because semantic technology works at the molecular level preventing structure from being imposed prematurely.

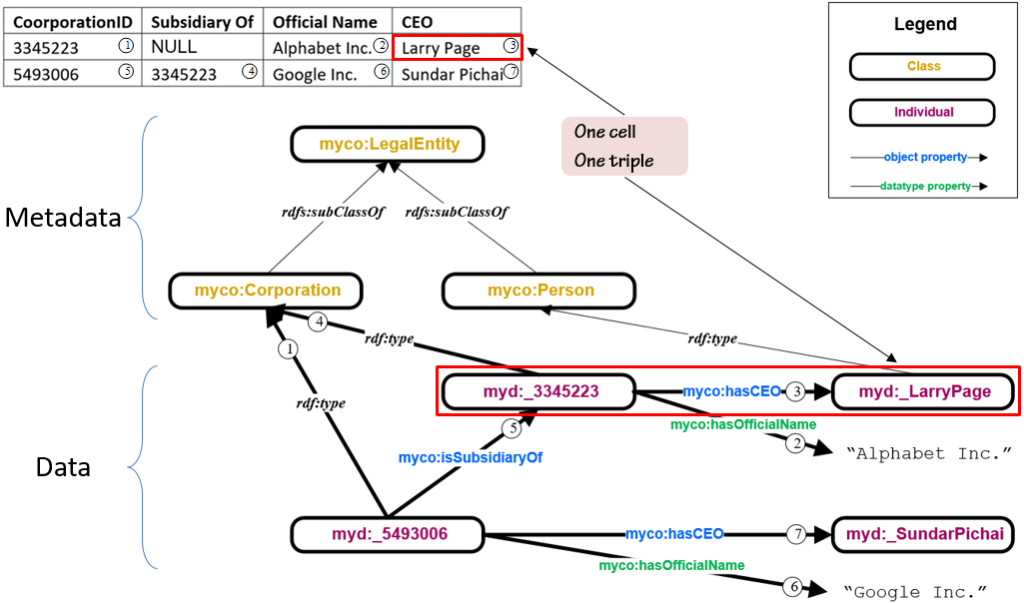
Knowledge graphs are made up of globally unique information units (atoms) which are then combined into triples (molecules). Unlike water’s two elements, ontologies establish a large collection of elements from which the required set of triples (molecules) are created. Triples are comprised of a Subject, Predicate, and Object. Each triple is an assertion of some fact about the Subject. Triples in the knowledge graph are all independently floating around in a database affectionately known as a “bag of triples” because of its fluid nature.

Semantic technology stores meaning in a knowledge graph using Description Logics to formalize what our minds conceptualize. Water can be stored in many containers and still come out as water just like a knowledge graph can be distributed across multiple databases and still contain the same meaning. Data storage and data consumption are separate concerns that should be disambiguated from one another.

Semantic technology is here, robust and mature, and fully ready to take on enterprise data management. Rows and columns have taken us a long way, but they are getting a bit soggy.

It’s time to stop imposing artificial structure when storing our data and instead focus on meaning. Let’s make semantic technology our default approach to handling the data tsunami.

Blog post by Mark Ouska

What will we talk about at the Data-Centric Conference?

“The knowledge graph is the only currently implementable and sustainable way for businesses to move to the higher level of integration needed to make data truly useful for a business.”

data-centric conferenceYou may be wondering what some of our Data-Centric Conference panel topics will actually look like, what the discussion will entail. This article from Forbes is an interesting take on knowledge graphs and is just the kind of thing we’ll be discussing at the Data-Centric Conference.

When we ask Siri, Alexa or Google Home a question, we often get alarmingly relevant answers. Why? And more importantly, why don’t we get the same quality of answers and smooth experience in our businesses where the stakes are so much higher?

The answer is that these services are all powered by extensive knowledge graphs that allow the questions to be mapped to an organized set of information that can often provide the answer we want.

Is it impossible for anyone but the big tech companies to organize information and deliver a pleasing experience? In my view, the answer is no. The technology to collect and integrate data so we can know more about our businesses is being delivered in different ways by a number of products. Only a few use constructs similar to a knowledge graph.

But one company I have been studying this year, Cambridge Semantics, stands out because it is focused primarily on solving the problems related to creating knowledge graphs that work in businesses. Cambridge Semantics technology is powered by AnzoGraph, its highly scalable graph database, and uses semantic standards, but the most interesting thing to me is how the company has assembled all the elements needed to create a knowledge graph factory.  Because in business we are going to need many knowledge graphs that can be maintained and evolved in an orderly manner.

Read more here: Is The Enterprise Knowledge Graph Finally Going To Make All Data Usable?

Register for the conference here.

P.S. The Early Bird Special for Data-Centric Conference registration runs out 12/31/18.


The Data-Centric Revolution: Implementing a Data-Centric Architecture

Dave McComb returns to The Data Administration Newsletter with news of roll-your-own data-centric architecture stacks. Rather, he makes an introduction to what the early adopters of data-centric architectures will need to undertake the data-centric revolution and make such a necessary transition.

At some point, there will be full stack data-centric architectures available to buy, to use as a service or as an open source project.  At theThe Data-Centric Revolution: Implementing a Data-Centric Architecture moment, as far as we know, there isn’t a full stack data-centric architecture available to direct implementation.  What this means is that early adopters will have to roll their own.

This is what the early adopters I’m covering in my next book have done and—I expect for the next year or two at least— what the current crop of early adopters will need to do.

I am writing a book that will describe in much greater detail the considerations that will go into each layer in the architecture.

This paper will outline what needs to be considered to become data-centric and give people an idea of the scope of such an undertaking.  You might have some of these layers already covered.

Find his answers in The Data-Centric Revolution: Implementing a Data-Centric Architecture.

Click here to read a free chapter of Dave McComb’s book, “The Data-Centric Revolution”.

The Data-Centric Revolution: Implementing a Data-Centric Architecture

At some point, there will be full stack data-centric architectures available to buy, to use as a service or as an open source project.  At the moment, as far as we know, there isn’t a full stack data-centric architecture available to direct implementation.  What this means is that early adopters will have to roll their own.

This is what the early adopters I’m covering in my next book have done and—I expect for the next year or two at least— what the current crop of early adoptersThe Data-Centric Revolution will need to do.

I am writing a book that will describe in much greater detail the considerations that will go into each layer in the architecture.

This paper will outline what needs to be considered to give people an idea of the scope of such an undertaking.  You might have some of these layers already covered.

Simplicity

There are many layers to this architecture, and at first glance it may appear complex.  I think the layers are a pretty good separation of concern, and rather than adding to the complexity, I believe it may simplify it.

As you review the layers, do so through the prism of the two driving APIs.  There will be more than just these two APIs and we will get into the additional ones, as appropriate, but this is not going to be the usual Swiss army knife of a whole lot of APIs, with each one doing just a little bit.  The APIs are of course RESTful.

The core is composed of two APIs (with our working titles):

  • ExecuteNamedQuery—This API assumes a SPARQL query has been stored in the triple store and given a name. In addition, the query is associated with a set of substitutable parameters.  At run time, the name of the query is forwarded to the server with the parameter names and values.  The back end fetches the query, rewrites it with the parameter values in place, executes that, and returns it to the client.  Note that if the front end did not know the names of the available queries, it could issue another named query that returns all the available named queries (with their parameters).  Also note that this also implies the existence of an API that will get the queries into the database, but we’ll cover that in the appropriate layer when we get to it.
  • DeltaTriples—This API accepts two arrays of triples as its payload. One is the “adds” array, which lists the new triples that the server needs to create, and the other is “deletes,” which are the triples to be removed.  This puts a burden on the client.  The client will be constructing a UI from the triples it receives in a request, allowing a user to change data interactively, and then evaluate what changed.  This part isn’t as hard as it sounds when you consider that order is unimportant with triples.  There will be quite a lot going on with this API as we descend down the stack, but the essential idea is that this API is the single route through which all updates pass through, and will ultimately result in an ACID compliant transaction being updated to the triple store.

I’m going to proceed from the bottom (center) of the architecture up, with consideration for how these two key APIs will be influenced by each of the layers.

A graphic that ties this all together appears at the end of this article.

Data Layer

At the center of this architecture is the data.  It would be embarrassing if something else were at the center of the data-centric architecture.  The grapefruit wedges here are each meant to represent a different repository. There will be more than one repository in the architecture.

The darker yellow ones on the right are meant to represent repositories that are more highly curated.  The lighter ones on the left represent those less curated (perhaps data sets retrieved from the web).  The white wedge is a virtual repository.  The architecture knows where the data is but resolves it at query time. Finally, the cross hatching represents provenance data.  In most cases, the provenance data will be in each repository, so this is just a visual clue.

The two primary APIs bottom out here, and become queries and updates.

Federation Layer

One layer up is the ability to federate a query over multiple repositories.  At this time, we do not believe it will be feasible or desirable to spread an update over more than one repository (this would require the semantic equivalent of a two-phased commit).  In most implementations this will be a combination between native abilities of a triple store, reliance on support for the standards-based federation, and bespoke capability.  The federation layer will be interpreting the ExecuteNamedQuery requests.

Click here to read more on TDAN.com

Are You Spending Way Too Much on Software?

Alan Morrison, senior research fellow at PwC’s Center for Technology and Innovation, interviews Dave McComb forstrategy+business about why IT systems and software continue to cost more, but still under-deliver. McComb argues that legacy processes, excess code, and a mind-set that accepts high price tags as the norm have kept many companies from making the most of their data.

Global spending on enterprise IT could reach US$3.7 trillion in 2018, according to Gartner. The scale of this investment is surprising, given the evolution of the IT sector. Basic computing, storage, and networking have become commodities, and ostensibly cheaper cloud offerings such as infrastructure-as-a-service and Are you spending too much on software? software-as-a-service are increasingly well established. Open source software is popular and readily available, and custom app development has become fairly straightforward.

Why, then, do IT costs continue to rise? Longtime IT consultant Dave McComb attributes the growth in spending largely to layers of complexity left over from legacy processes. Redundancy and application code sprawl are rampant in enterprise IT systems. He also points to a myopic view in many organizations that enterprise software is supposed to be expensive because that’s the way it’s always been.

McComb, president of the information systems consultancy Semantic Arts, explores these themes in his new book, Software Wasteland: How the Application-Centric Mindset Is Hobbling Our Enterprises. He has seen firsthand how well-
intentioned efforts to collect data and translate it into efficiencies end up at best underdelivering — and at worst perpetuating silos and fragmentation. McComb recently sat down with s+b and described how companies can focus on the standard models that will ultimately create an efficient, integrated foundation for richer analytics.

Click here to read the Question & Answer session.

The gist Namespace Delimiter: Hash to Slash

The change in gist:

gist namespace delimiter

We recently changed the namespace for gist from

  • http://ontologies.semanticarts.com/gist#
    to
  • http://ontologies.semanticarts.com/gist/

What you need to do:

This change is backwards-incompatible with existing versions of gist. The good news is that the changes needed are straightforward. To migrate to the new gist will require changing all uses of gist URIs to use the new namespace. This will include the following:

  1. any ontology that imports gist
  2. any ontology that does not import gist, but that refers to some gist URIs
  3. any data set of triples that uses gist URIs

For 1 and 2, you need only change the namespace prefix and carry on as usual.  For files with triples that use namespaces you need to first change the namespaces and then reload the triples into any triple stores where the old files were loaded into.  If there triples use prefixed terms, then you need only change the prefixes. If the triples use full URIs then you will need to go a global replace swapping out the old namespace for the new one.

The rationale for making this change:

We think that other ontologists and semantic technologists may be interested in the reasons for this change. To that end, we re-trace the thought process and discussions we had internally as we debated the pros and cons of this change.

There are three key aspects of URIs that we are primarily interested in:

  • Global Uniqueness – the ability of triple stores to self-assemble graphs without resorting to metadata relies on the fact that URIs are globally unique
  • Human readability – we avoid traditional GUIDs because we prefer URIs that humans can read and understand.
  • Resolvability – we are interested in URIs that identify resources that could be located and resolved on the web (subject to security constraints).

The move from hash to slash was motivated by the third concern, the first two are not affected.

In the early days the web was a web of documents.  For efficiency reasons, the standards (including and especially RFC 3986[1]) declared that the hash designated a “same-document reference” that is everything after the hash was assumed to be in the document represented by the string up to the hash.  Therefore, the resolution was done in the browser and not on the server. This was a good match for standards, and for small (single document) ontologies.  As such, for many years, most ontologies used the hash convention, including owl, rdf, skos, void, vcard, umbel and good relations.

Anyone with large ontologies or large datasets that were hosted in databases and not documents adapted the / convention, including DBpedia, Schema.org, Snomed, Facebook, Foaf, Freebase, Open Cyc and the New York Times.

The essential tradeoff is for resolving the URI.  If you can be reasonably sure that everything you would want to provide to the user at resolution time, would be in relatively small document, then the hash convention is fine.

If you wish your resolution to have additional data that may not have been in the original document (say where used information that isn’t in the defining document) you need to do the resolution on the server.  Because of the standards, the server does not see anything after the hash so if you use the hash convention, rather that resolving the uri from the url address bar, you must programmatically call a server with the URI as an argument in the API call.

With the slash convention you have the choice of putting the URI in the URL bar and getting it resolved, or calling an API similar to the hash option above.

If you commit to API calls then there is a slight advantage to hash as it is slightly easier to parse on the back end.  In our opinion this slight advantage does not compare to the flexibility of being able to resolve through the URL bar as well as still having the option of using an API call for resolution.

The DBpedia SPARQL endpoint (http://dbpedia.org/sparql ) has thoughtfully prepopulated 240 of the most common namespaces in their Sparql editor.  At the time of this writing, 59 of the 240 use the hash delimiter.  Nearly 100 of the namespaces come from DBpedia’s decision to have a different namespace for each language, and when these are excluded the slash advantage isn’t nearly as pronounced (90 slashes versus 59 hashes) but still a predominance for slash.

We are committed to providing, in the future, a resolution service to make it easy to resolve our concepts through a URL address bar.  For the present the slash is just as good for all other purposes.  We have decided to eat the small migration cost now rather than later.

[1] https://www.rfc-editor.org/info/rfc3986

Data-Centric vs. Application-Centric

Data-Centric vs. Software Wasteland

Dave McComb’s new book “Software Wasteland: How the Application-Centric Mindset is Hobbling our Enterprises” has just been released.

In it, I make this case that the opposite of Data-Centric is Application Centric, and our preoccupation with Application-Centric approaches over the last several decades has caused the cost and complexity of our information systems to be at least 10 times what they should be and in most cases we’ve examined, 100 times what they should be.

This article is a summary about how diametrically opposed these two world views are, and how the application-centric mind set is draining our corporate coffers.

An information system is essentially data and behavior.

On the surface, you wouldn’t think it would make much difference with which one you started with if you need both and they feed off each other.  But it turns out it does make a difference.  A very substantial difference.

Screen Shot 2018-03-04 at 10.20.54 PM

What does it do?

The application-centric approach starts with “what does this system need to do?” Often this is framed in terms of business process and/or work flow.  In the days before automation, information systems were work flow systems.  Humans executed tasks or procedures.  Most tasks had prerequisite data input and generated data output.  The classic “input / process / output” mantra described how work was organized.

Information in the pre-computer era was centered around “forms.”  Forms were a way to gather some prerequisite data, which could then be processed.  Sometimes the processing was calculation.  The form might be hours spent and pay rate, and the calculation might be determining gross pay.

These forms also often were filed, and the process might be to retrieve the corresponding form, in the corresponding (paper) file folder and augment it as needed.

While this sounds like ancient history, it persists.  If you’ve been the doctor recently, you might have noticed that despite decades of “Electronic Medical Records,” the intake is weirdly like it always has been: paper form based.

This idea that information systems are the automation of manual work flow tasks continues.  In the Financial Service industry, it is called RPA (Robotic Process Automation) despite the fact that there are no robots.  What is being automated are the myriad of tasks that have evolved to keep a Financial Services firm going.

When we automate a task in this way, we buy into a couple of interesting ideas, without necessarily noticing that we have done so.  The first is that automating the task is the main thing.  The second is that the task defines how it would like to see the input and how it will organize the output.  This is why there are so many forms in companies and especially in the government.

The process automation essentially exports the problem of getting the input assembled and organized into the form the process wants.  In far too many cases this falls on the user of the system to input the data, yet again, despite the fact that you know you have told this firm this information dozens of times before.

In the cases where the automation does not rely on a human to recreate the input, something almost as bad is occurring: developers are doing “systems integration” to get the data from wherever it is to the input structures and then aligning the names, codes and categories to satisfy the input requirements.

Most large firms have thousands of these processes.  They have implemented thousands of application systems, each of which automates anywhere between a handful and dozens of these processes.  The “modern” equivalent of the form is the document data structure.  A document data structure is not a document in the same way that Microsoft Word creates a document. Instead, a document data structure is a particular way to organize a semi-structured data structure.  The most popular now is json (javascript object notation).

A typical json document looks like:

{‘Patient’: {‘id’: ‘12345’, ‘meds’: [ ‘2345’, ‘3344’, ‘9876’] } }

Json relies on two primary structures: lists and dictionaries.  Lists are shown inside square brackets (the list following the work ‘meds’ in the above example).  Dictionaries are key / value pairs and are inside the curly brackets.  In the above ‘id’ is a key and ‘12345’ is the value, ‘meds’ is a key and the list is the value, and ‘Patient’ is a key and the complex structure (a dictionary that contains a both simple values and lists) is the value.  These can be arbitrarily nested.

Squint very closely and you will see the document data structure is our current embodiment of the form.

The important parallels are:

  • The process created the data structure to be convenient to what the process needed to do.
  • There is no mechanism here for coordinating or normalizing these keys and values.

Process-centric is very focused on what something does.  It is all about function.

Click here to continue reading on TDAN.com

A Tale of Two Projects

If someone has a $100 million project, the last thing that would occur to them would be to launch a second project in parallel using different methods to see which method works better. That would seem to be insane, almost asking for the price to be doubled. Besides, most sponsors of projects believe they know the best way to run such a project.

However, setting up and running such a competition would establish once and for all what processes work best for large scale application implementations. There would be some logistical issues to be sure, but well worth it. To the best of my knowledge, though, this hasn’t happened.

Thankfully, the next best thing has happened. Luckily, we have recently encountered a “natural experiment” in the world of enterprise application development and deployment. We are going to mine this natural experiment for as much as we can.

President Barack Obama signed the Affordable Care Act into law in March 23, 2010. The project was awarded to CGI Federal, a division of the Canadian company, CGI, for $93.7 million. I’m always amused at the spurious precision the extra $0.7 million implies. It sort of signals that somebody knows exactly how much this project is going to cost. It is just the end product of some byzantine negotiating process. It was slated to go live October 2013. (I was blissfully unaware of this for the entire three years the project was in development).

One day in October 2013, one of my developers came into my office and told me he had just heard of an application system comprising over 500,000,000 lines of code. He couldn’t fathom what you would need 500,000,000 lines of code to do. He was a recent college graduate, had been working for us for several years, and had written a few thousand lines of elegant architectural code. We were running major parts of our company on these few thousand lines of code so he was understandably puzzled at what this could be.

We sat down at my monitor and said, “Let’s see if we can work out what they are doing.”

This was the original, much maligned rollout of Healthcare.gov. We were one of the few that first week who managed to log in and try our luck (99% of the people who tried to access healthcare.gov in its first two weeks were unable to complete a session).

As each screen came up, I’d say “what do you think this screen is doing behind the scenes?” and we would postulate, guess a bit as to what else it might be doing, and jot down notes on the effort to recreate this. For instance, on the screen when we entered our fake address (our first run was aborted when we entered a Colorado address as Colorado was doing a state exchange) we said, “What would it take to write address validation software?” This was easy, as he had just built an address validation routine for our software.

After we completed the very torturous process, we compiled our list of how much code would be needed to recreate something similar. We settled on perhaps tens of thousands of lines of code (if we were especially verbose). But no way in the world was there any evidence in the functionality of the system that there was a need for 500,000,000 lines of code.

Meanwhile news was leaking that the original $93 million project had now ballooned to $500 million.

In the following month, I had a chance encounter with the CEO of Top Coder, a firm that organizes the equivalent of X prizes for difficult computer programming challenges. We discussed Healthcare.gov. My contention was that this was not the half-billion dollar project that it had already become, but was likely closer to the coding challenges that Top Coder specialized in. We agreed that this would make for a good Top Coder project and began looking for a sponsor.

Life imitates art, and shortly after this exchange, we came across HealthSherpa.com. The Health Sherpa User Experience was a joy compared to Healthcare.gov. I was more interested in the small team that had rebuilt the equivalent for a fraction (a tiny fraction) of the cost.

From what I could tell from a few published papers, a small team of three to four in two to three months had built equivalent functionality to that which hundreds of professionals had spent years laboring over. This isn’t exactly equivalent. It was much better in some ways, and fell a bit short in a few others.

In the ensuing years, I’d used this as a case study of what is possible in the world of enterprise (or larger) applications. Over the course of the ensuing four years, I’ve been tracking both sides of this natural experiment from afar.

I looked on in horror to watch the train wreck of the early rollout of Healthcare.org balloon from $1/2 billion to $1 billion (many firms have declared victory in “fixing” the failed install for a mere incremental $1/2 billion), and more recently to $2.1 billion. By the 2015 enrolment period, Healthcare.gov had adopted the HealthSherpa user experience, which they now call “Marketplace lite.” Meanwhile HealthSherpa persists, having enrolled over 800,000 members, and at times handles 5% of the traffic for the ACA.

healthcare.gov example

The writing of Software Wasteland prompted me to research deeper, in order to crisp up this natural experiment playing out in front of us. I interviewed George Kalogeropoulos, CEO of HealthSherpa, several times in 2017, and have reviewed all the available public documentation for Healthcare.gov and HealthSherpa.

The natural experiment that has played out here is around the hypothesis that there are application development and deployment process that can change the resource consumption and costs by a factor of 1,000. As with the Korean Peninsula, you can nominate either side to be the control group. In the Korea example, we could say that communism was the control group and market democracy the experiment. The hypothesis would be that the experiment would lead to increased prosperity. Alternatively, you could pose it the other way around: market democracy is the control and dictatorial communism is the experiment that leads to reduced prosperity.

If we say that spending a billion dollars for a simple system is the norm (which it often is these days) then that becomes the control group, and agile development becomes the experiment. The hypothesis is that adopting agile principles can improve productivity by many orders of magnitude. In many settings, the agile solution is not the total solution, but in this one (as we will see), it was sufficient.

This is not an isolated example – it is just one of the best side-by-side comparisons. What follows is more evidence that application development and implementation are far from waste-free.


Do you want to read more? Click here.

Software Wasteland

Software Wasteland: Know what’s causing application development waste so you can turn the tide.

software wasteland

Software Wasteland is the book your Systems Integrator and your Application Software vendor don’t want you to read. Enterprise IT (Information Technology) is a $3.8 trillion per year industry worldwide. Most of it is waste.

We’ve grown used to projects costing tens of millions or even billions of dollars, and routinely running over budget and schedule many times over. These overages in both time and money are almost all wasted resources. However, the waste is hard to see, after being so marbled through all the products, processes, and guiding principles. That is what this book is about. We must see, understand, and agree about the problem before we can take coordinated action to address it.

Take the dive and check out Software Wasteland here.

Ontology-based Applications

Once you have your ontology, you want to put it to use. We will describe a common scenario where data is extracted from various sources including relational databases. That data is then used in conjunction with an application instead of a traditional relational database. Things have advanced from just a few years ago when the main technologies were for representing the schema (RDF, RDFS), the data (RDF), and a query language (SPARQL).  Two new and important standards have come out to address extracting data from relational databases and for specifying constraints that are not available in OWL.

One good way to go about building an ontology-based application is as follows:

  1. Create ontology
  2. Create SHACL constraints
  3. Create triples
  4. Build program logic and user interface

This parallels how to build a traditional application.  The main difference is you are going to use a triple store to answer SPARQL queries instead of posing SQL queries to a relational database. Instead of creating conceptual, logical, and physical data models along with various integrity constraints, you will be building an ontology and SHACL constraints. Instead of having just one database and one data model per application, you can reuse either or both for multiple applications around the enterprise.

Create Ontology

Create the ontology for the chosen subject matter. Start with a core ontology that can be extended and used in a variety of applications across the enterprise.  This is similar to an agile approach, in that you start small and extend.  From the start, think about the medium and long term so that additions are natural extensions of the core ontology, which should be relatively stable.

Create SHACL Constraints

The ontology is modeling the real world, independently from any particular application. To build a specific application, you will be choosing a subset of the ontology classes and properties to use. Many but not all of the properties that are optional in the real world will remain optional in your application. Some properties that necessarily hold in the real world as reflected in the ontology will be of no interest for a particular application.

SHACL is a rich and complex standard with many intended uses. Three key ones are:

  1. Communicate what part of the ontology is to be used in the application.
  2. Communicate exactly what the triples need to look like that will be created and loaded into the triple store.
  3. Communicate to a SHACL engine exactly what integrity constraints are to be respected.

This process also forces you to examine all the aspects of the ontology that are needed for the application. It usually uncovers mistakes or gaps in the ontology. See Figure 1.

Figure 1: Creating Ontology, Constraints, and Triples


Create Triples

Triples can come from many sources, including text documents, web pages, XML documents, spreadsheets, and relational databases. The latter two are the most common, and the vendors have supplied tools to support this process. The W3C has also created a standard for mapping a relational schema to an ontology so that triples may be extracted directly from a relational database. That standard is called R2RML[1].  See Figure 2 to see how this works. An R2RML specification for this simple example would indicate the following:

  1. Each row in the corporation table will be an instance of the :Corporation.
  2. The IRI for each instance of :Corporation will use the myd: namespace, and the local name (after the colon) is to be an underscore followed by the value in the ‘CorporationID’ column.
  3. The ‘Subsidiary Of’ column corresponds to the :isSubsidiaryOf property.
  4. The ‘CEO’ column corresponds to the :hasCEO property.
  5. There is a foreign key connecting values of the ‘CEO’ column to a Person table.

With this information, the R2RML engine can reach into the relational database table and extract triples as indicated in Figure 2. Importantly, exactly one triple results from each cell in the table. If there’s a NULL, no triple is created.

If you need to create triples from spreadsheets, you can use vendor tools, create your own tool, or write ad hoc scripts.  There is not as much by way of out-of-the-box standards and tools for extracting triples from web pages, XML documents, and text documents.  Specialized scraping and natural processing tools may be available.

Figure 2: Tables to Triples


Build Program Logic & User Interface

This phase works much like the development of any other application. The main difference is that instead of querying a relational store using SQL, you are using SPARQL to query a triple store. See Figure 3.

Figure 3: Semantic Application Architecture


[1] https://www.w3.org/TR/r2rml/