
We've found ourselves working with D3(d3js.org) more and more lately, both for clients and for our own projects. So far we've really just begun to scratch the surface of what it can do (if you're unfamiliar, take a moment to browse the examples). Despite our relative lack of experience with the library, we've been able to crank out demos at a wonderfully satisfying pace thanks to our decision early on to focus on creating high-level, DRY abstractions. Though there is a ton of flexibility and extensibility, D3 does seem to have a few broad categories of visualizations based around the shape of input data. The one we're going to focus on here is the flare.js format, which looks roughly like this:
https://gist.github.com/scogle/15c1da0f631129da64a7
This format seems to be the basis of a large number of useful visualizations dealing with nested, tree-shaped data. The challenge is that in semantic systems it's just not possible to construct a SPARQL query that returns data in a format anywhere near the "flare" example above. What you're more likely to see something structurally very similar to this:
https://gist.github.com/scogle/471166e99b1b1a25b82f
So what to do? One path we could take is to write a server-side endpoint that returns data in the right structure, but this has the disadvantage of being less flexible, not to mention it spreads out concerns of the visualization layer wider than they need to be. The other option is to do the conversion on the front end. Rather than dive into writing a bespoke method to covert the specific data on hand to a format tailored to the visualization we want, why not take a step back and write a reusable abstraction layer? The end result, without giving too much away, looks roughly like this:
https://gist.github.com/scogle/cab5a3894a32a3122058
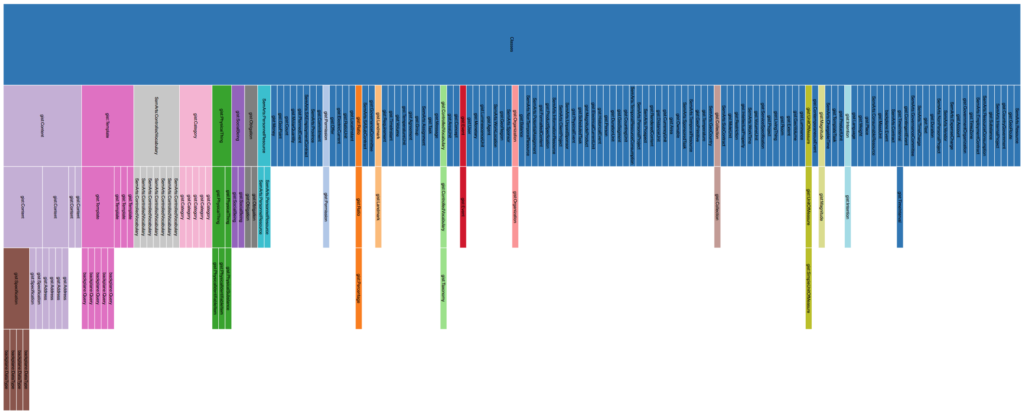
The advantage of this over D3's built-in nest() method is that it will recursively construct n-depth trees from flat data, as long as the relationships are consistently expressed. This eliminates one of the major time-consumers in creating these visualizations--the data conversion in a reusable and flexible way. But why stop there? We created abstractions for various visualizations as well. Now, creating an icicle graph (like the one above) is as simple as:
https://gist.github.com/scogle/7752abf671003cae5469
This is still in the early stages of development so it'll be some time before we release it to the public, but stay tuned.